Debugging plugin
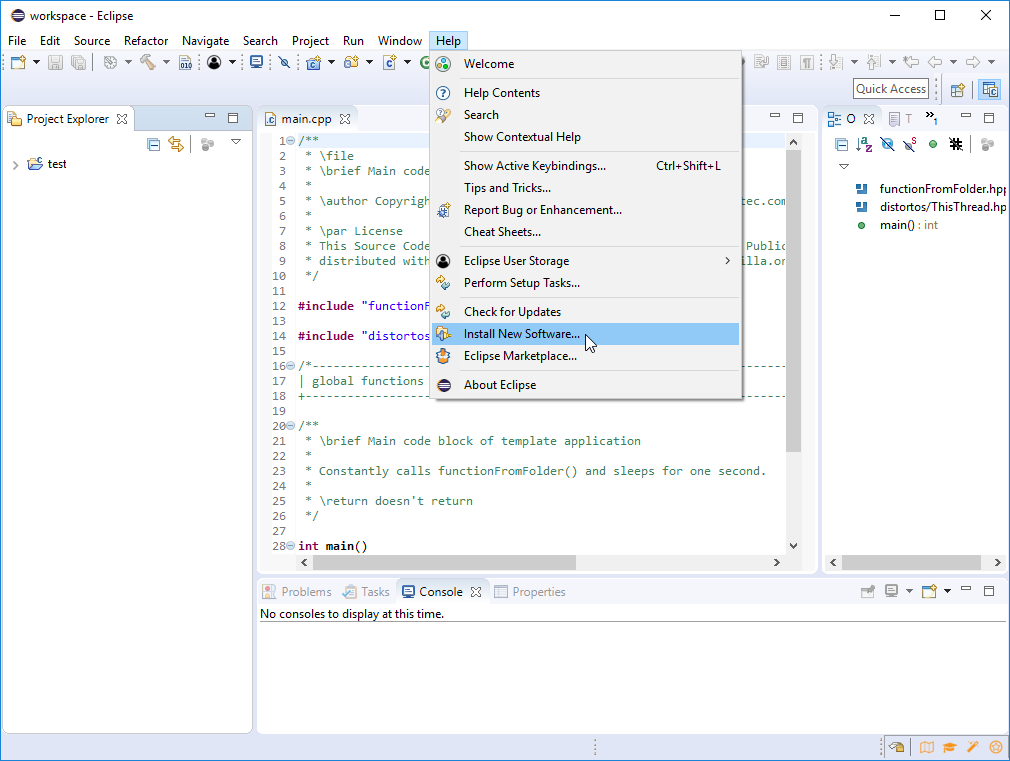
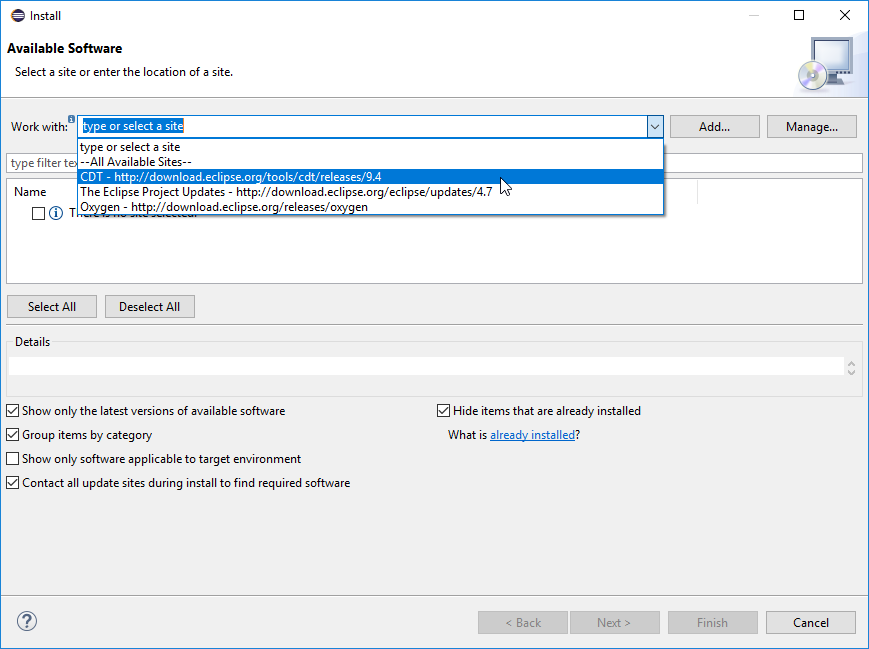
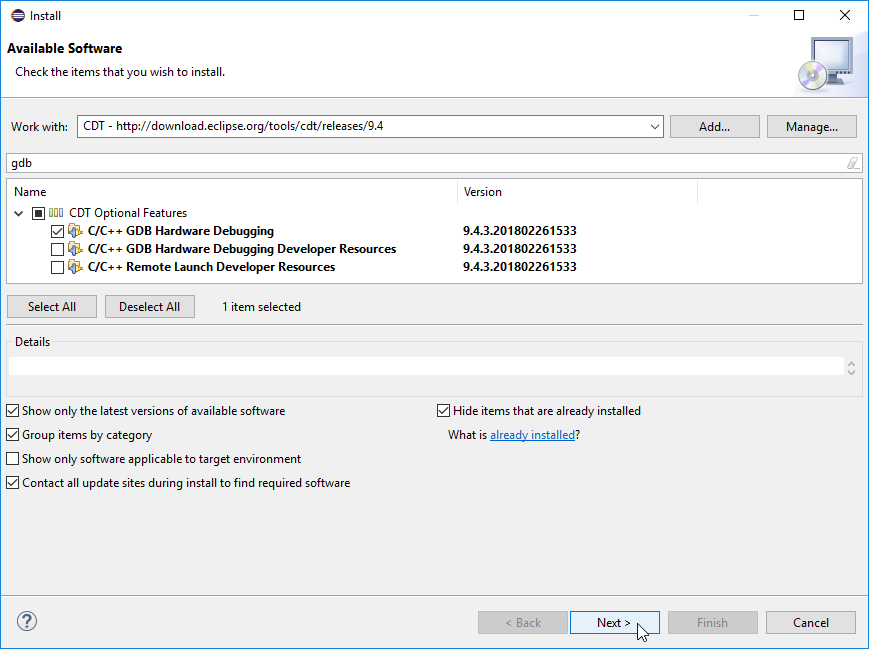
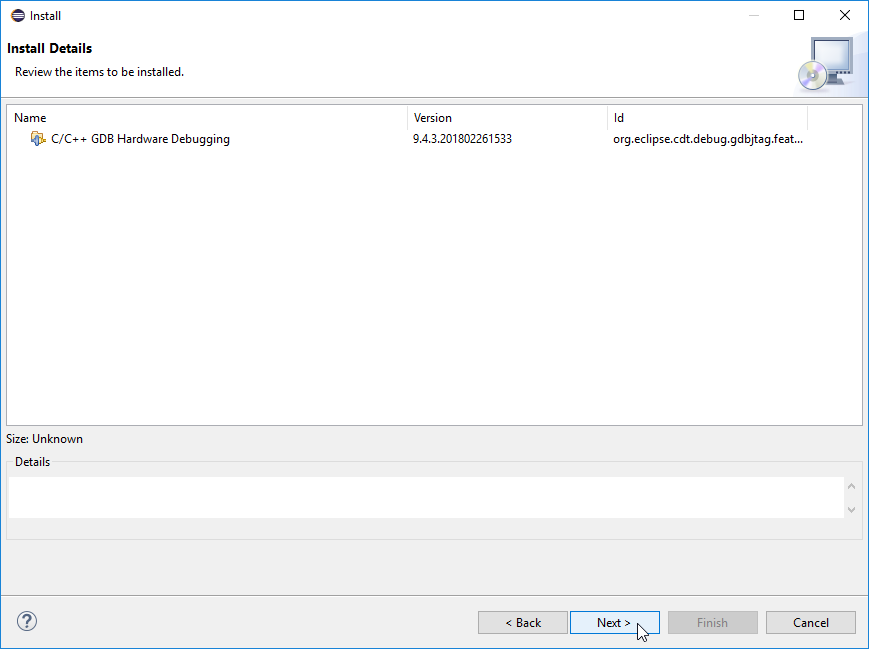
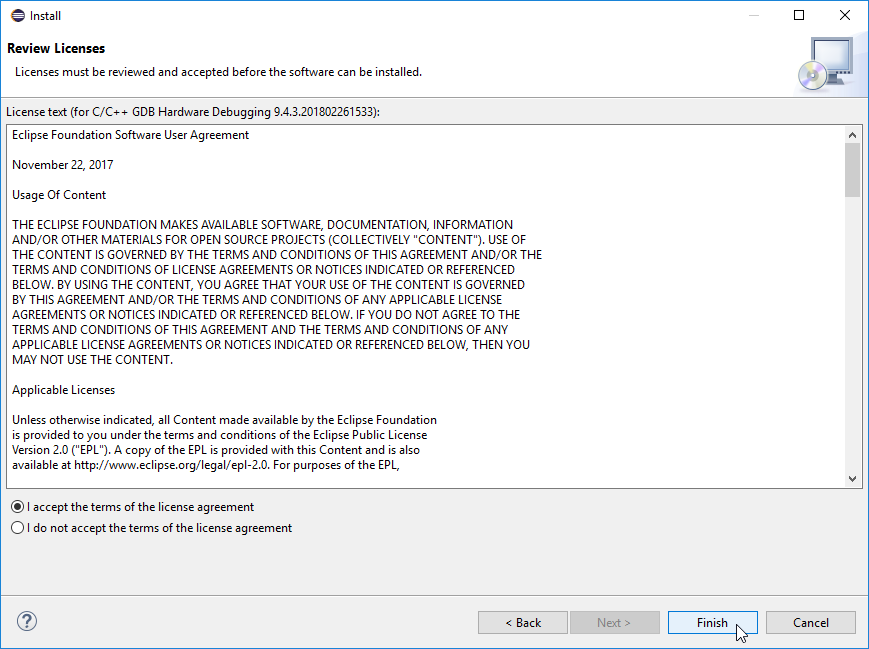
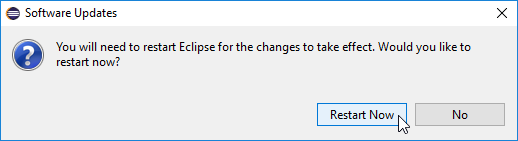
Before we can proceed any further, you have to install C/C++ GDB Hardware Debugging plugin for Eclipse. Click on Help menu and select Install New Software… to open the window titled Install. In this window from the Work with drop-down select the most recent CDT update site – this will be an entry like CDT - http://download.eclipse.org/tools/cdt/releases/X.Y (e.g. CDT - http://download.eclipse.org/tools/cdt/releases/9.4) or something very similar, depending on the version of Eclipse. Place your cursor in the filter text box – the one which has gray type filter text, just below Work with label – and enter gdb there. After a short while you should see a couple of suggestions – select the checkbox next to C/C++ GDB Hardware Debugging in the CDT Optional Features group and click Next at the bottom of the window. In the next step – Install Details – just click Next again. In the final step – Review Licenses – you have to select I accept the terms of the license agreement (obviously after you’ve read it carefully, understood completely and consulted your lawyers – which is what we all do when presented with a wall of incomprehensible legal text (; ) and click Finish. The process of plugin installation will take a short while (the progress will be displayed in the status bar at the bottom of Eclipse’s window) and when it finishes, you’ll be asked to restart Eclipse – confirm with Restart Now and you are done with this step.
Debug perspective
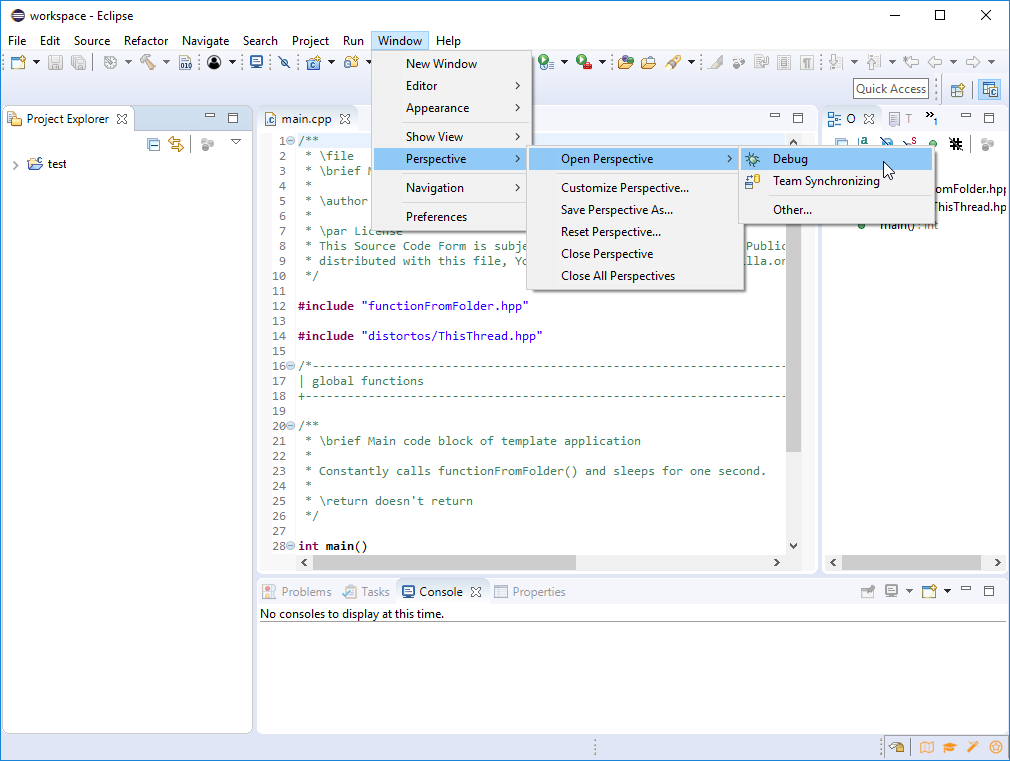
If you never did any debugging in your current Eclipse installation, the Debug perspective will not be visible. A perspective in Eclipse is the arrangement of panels, tabs, buttons and so on – all the previous screenshots were done in the default C/C++ perspective, which consists of Project Explorer on the left, editor in the center, Outline on the right and various tabs (Problems, Console, …) on the bottom. With minor exceptions (menu bar and toolbar at the top) the perspective affects almost all of what you see. To open Debug perspective click Window > Perspective > Open Perspective > Debug. Once it is opened, you can quickly switch between the perspectives using small buttons on the right side of the toolbar (right of the Quick Access text box) – first one (with a plus sign) is used to open more perspectives, next one (with letter C inside a square) is the C/C++ perspective and the last one (green bug) is the Debug perspective.
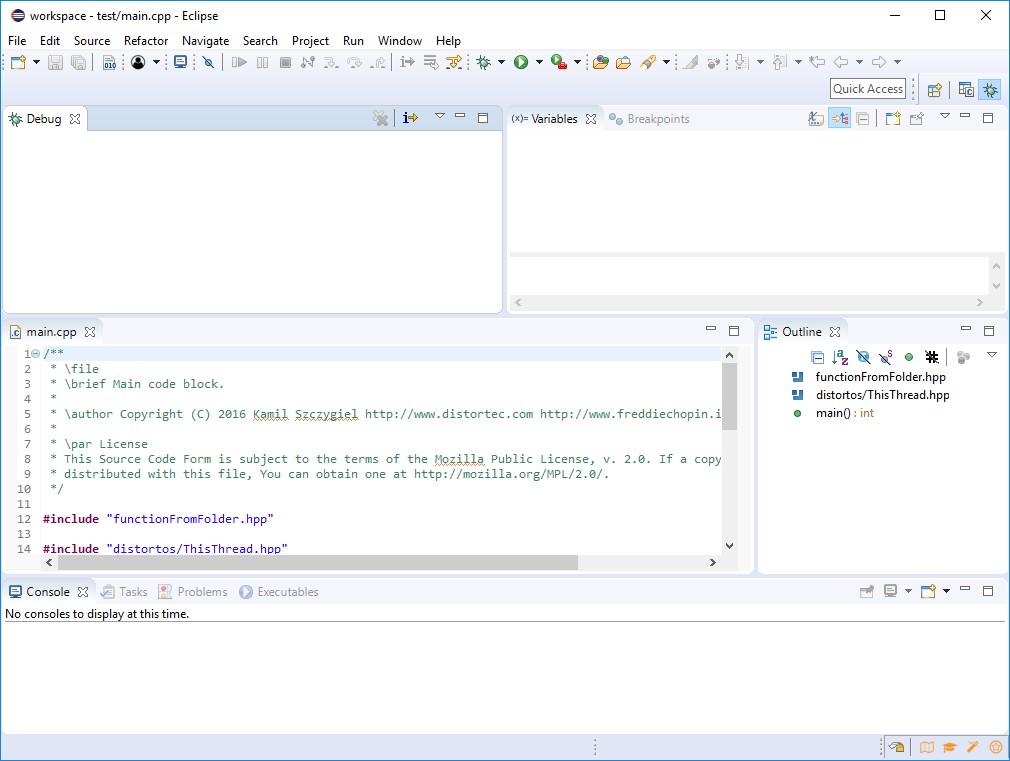
In Debug perspective Project Explorer is not visible at all, editor, Outline and panel with various tabs (Console, Problems, …) are moved a bit lower, while the top part of the window is occupied by the Debug tab on the left (this is where the call stack will be displayed) and the right part is reserved for tabs like Variables, Breakpoints, Registers, Expressions and some others.
Configuring and running OpenOCD
This is actually the most tricky part of the whole process, as the exact procedure is slightly different for every board or a combination of debugging interface with target chip. In this paragraph we will be using a STM32F4DISCOVERY board, so for a different setup you’ll need to adjust some configurations accordingly. It is also worth noting that drivers for the debugging interface – so in case of our board this would be ST-LINK/V2 – have to be installed in your system (if not already present), otherwise the steps described further in this chapter will fail to work.
OpenOCD works as a GDB remote server, so it is basically a middleman between GDB debugger and the hardware. Whenever you want to start a debugging session, OpenOCD should be running in the background. If your debugging session ends, you don’t have to quit or restart OpenOCD – it may continue running in the background as long as required. OpenOCD also doesn’t have to be started via Eclipse – you may start it manually in the terminal emulator if you like. In fact – OpenOCD doesn’t even need to run on the same machine as your debugger, as long as it is accessible via network. But let’s get back to the main topic…
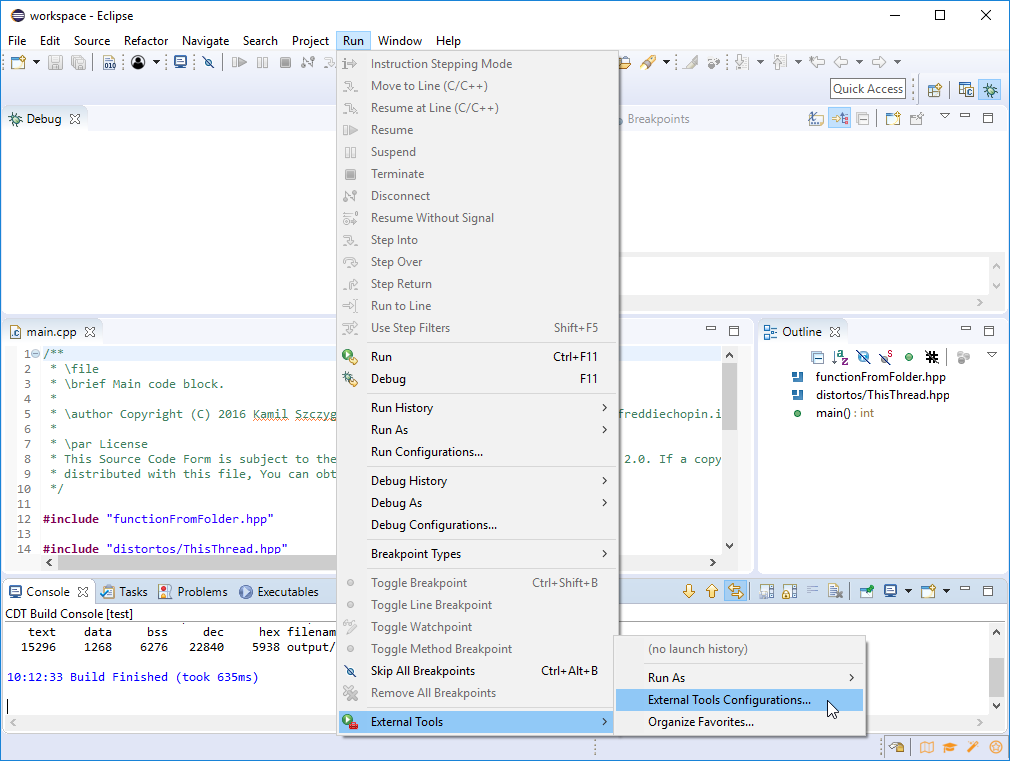
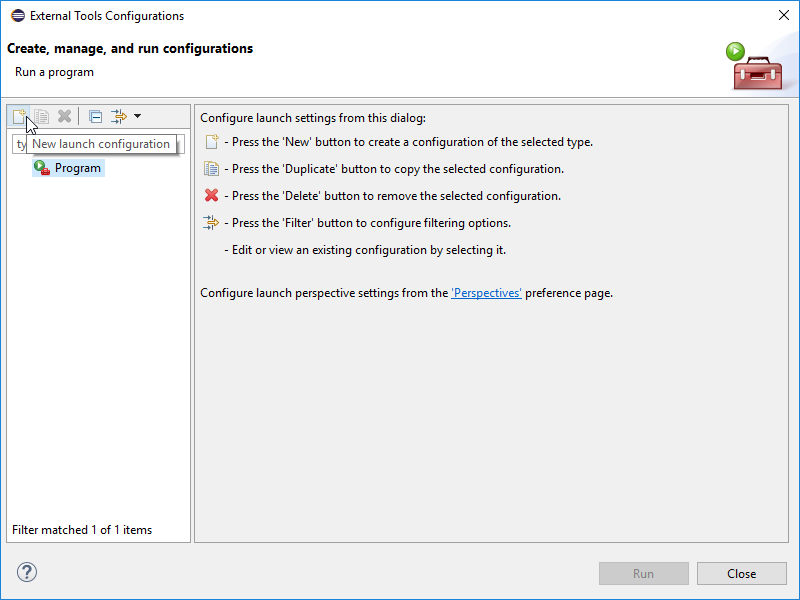
Eclipse has a feature called External Tools, which allows you to run any executable you like, right from the IDE. This is what we will use to start OpenOCD. To create a new configuration go to Run > External Tools > External Tools Configurations…, from the list on the left select Program and click the New launch configuration button (sheet of paper with a plus sign, first one from left above the list). Alternatively you can just double-click on Program item in the left list.

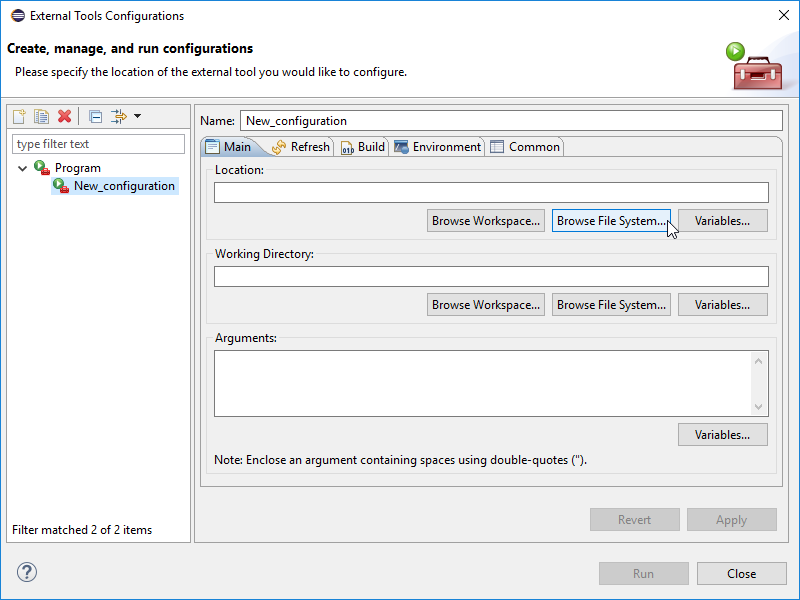
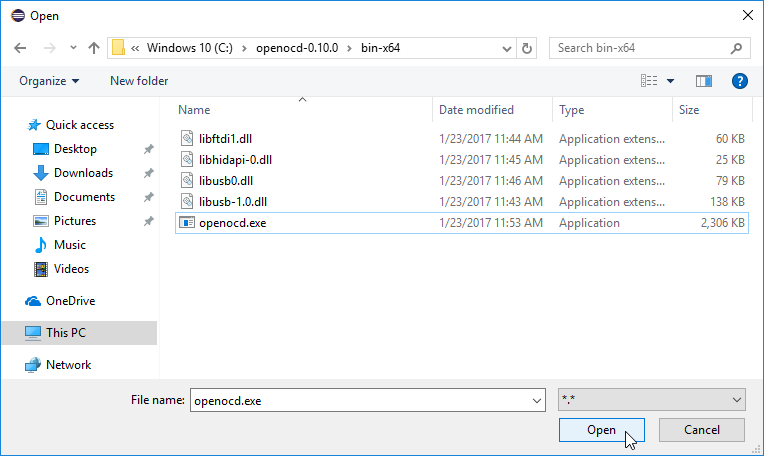
Select the program which is going to be executed with Browse File System… button in the Location group in the Main tab. Navigate to the folder with OpenOCD binary (i.e. C:\openocd-0.10.0\bin-x64 for 64-bit Windows, /usr/bin for Linux), select the executable (openocd.exe for Windows, openocd for Linux) and click Open to close the window. Place the cursor in Arguments text box at the bottom of Main tab and enter any arguments which should be passed to OpenOCD – in case of STM32F4DISCOVERY board this would be just -f board/stm32f4discovery.cfg. At this point you may also change the name of the launch configuration from the default New_configuration to something more descriptive. Personally I name the configurations either openocd + <board> or openocd + <interface> + <target>, so in this case I called it openocd + stm32f4discovery. You can save current state of configuration with Apply button.

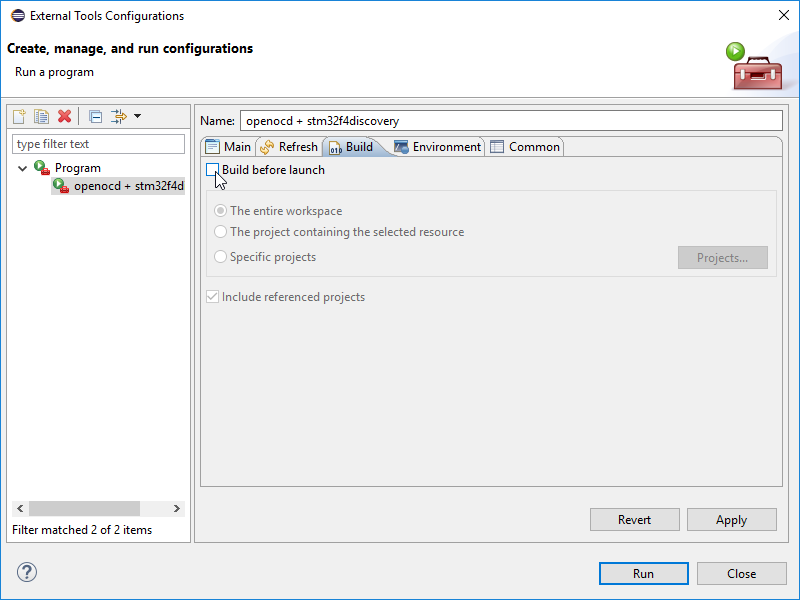
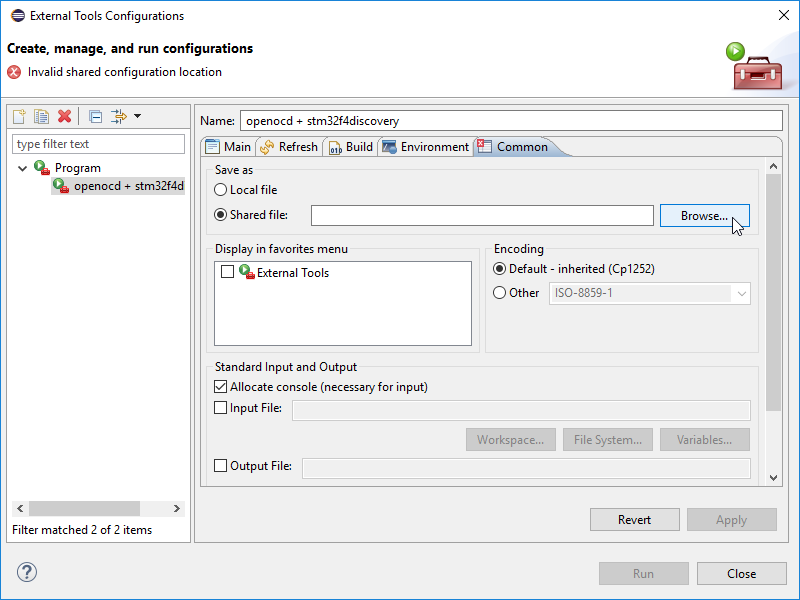
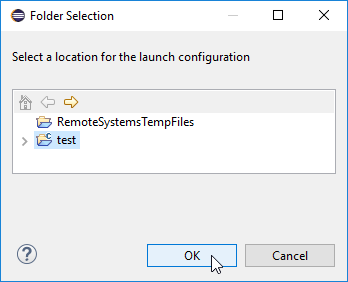
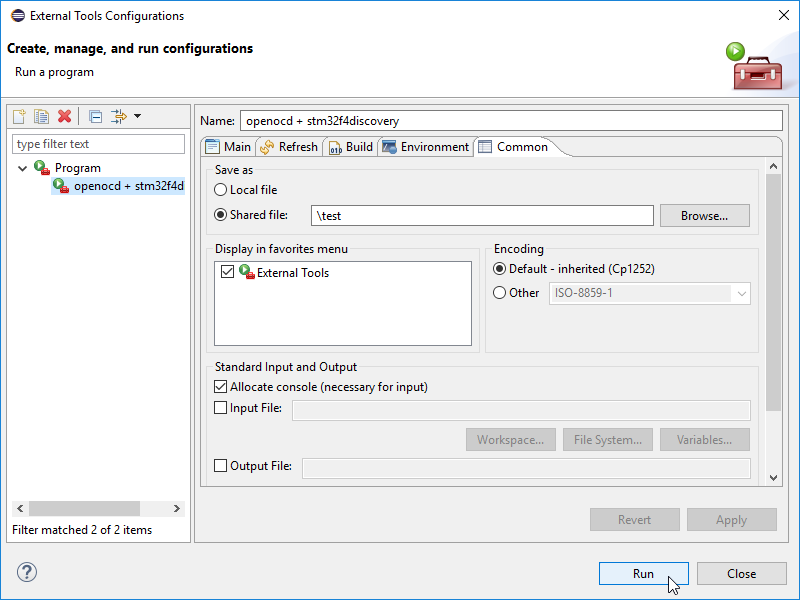
Actually at this point the configuration is already usable, but there are just a few minor things worth configuring. Switch to Build tab and deselect Build before launch. Building your project before starting OpenOCD is useful if you’d like to use OpenOCD to program the chip, but in case of a typical debugging session this is not necessary here (we’ll get to that later – in chapter about GDB configurations). In Common tab in Save as group you may select whether this launch configuration will be saved inside Eclipse’s workspace configuration – this is called Local file (misleading if you ask me) – or as a regular file called <name>.launch somewhere in the workspace – this is called Shared file. My personal practice is to use the second option, save the file in project’s folder and back it up with version control system (like git). With such approach it is very easy to migrate the project and its launch configurations between different computers. It is also possible to copy such launch configuration file between different projects – in 99.666% of cases OpenOCD launch configurations are hardware-specific only (they have no project-specific parts). To do it this way select Shared file in Save as group, click Browse… button right from this option, select your project’s folder (test in our example) and click OK. For easy access to this launch configuration you may also select External Tools item in the Display in favorites menu. Save your configuration again (Apply button) and click Run to test it.
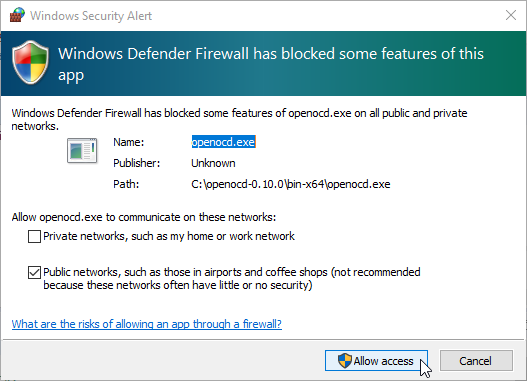
If you are a Windows user and this is the first time you run selected OpenOCD executable, you may see a Windows Security Alert window. Just select Allow access so that OpenOCD could use network features it requires.
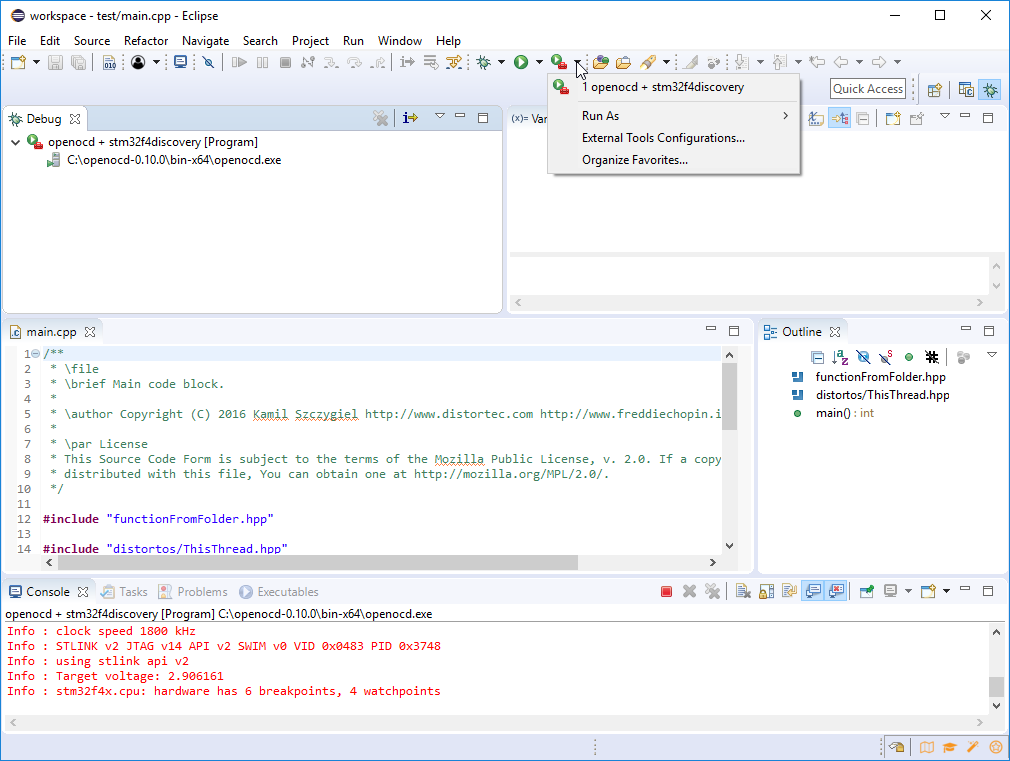
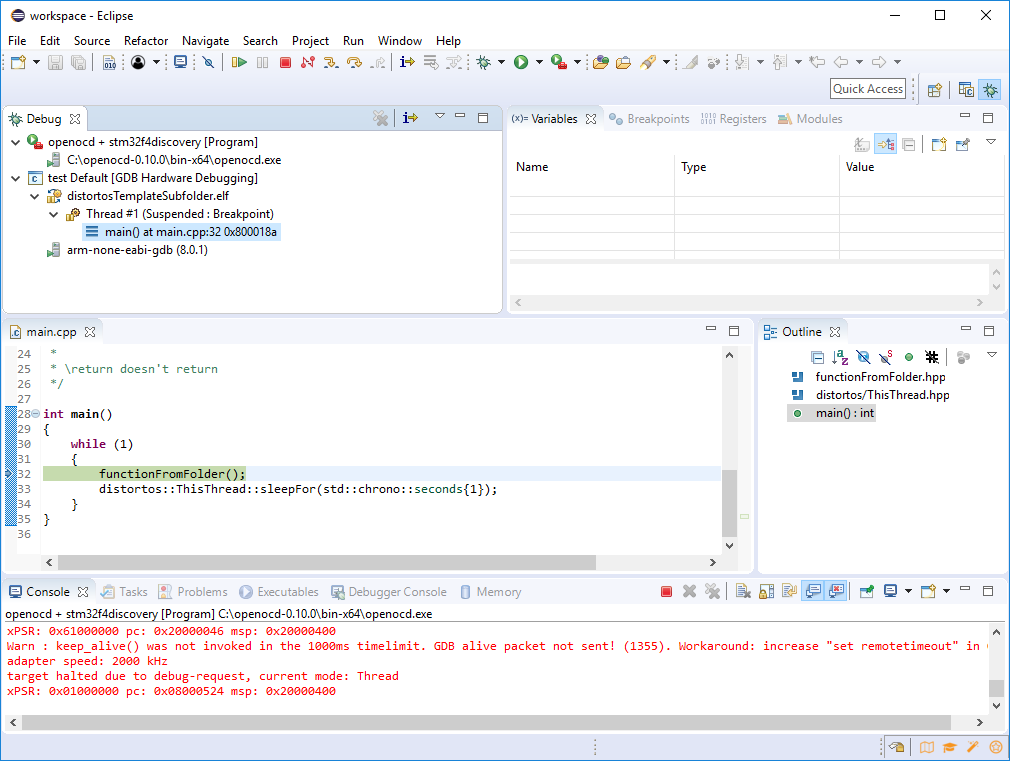
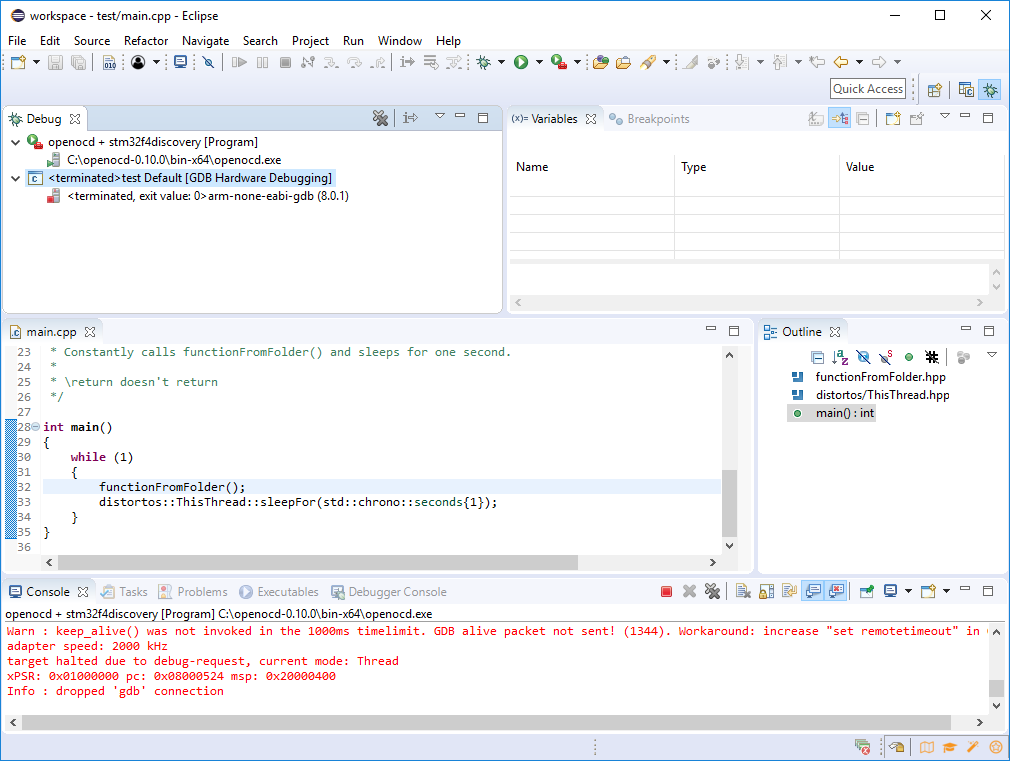
If everything worked well, you should see your launch configuration running in the Debug tab in the top-left panel of Eclipse’s window, as well as some info in the Console tab at the bottom.

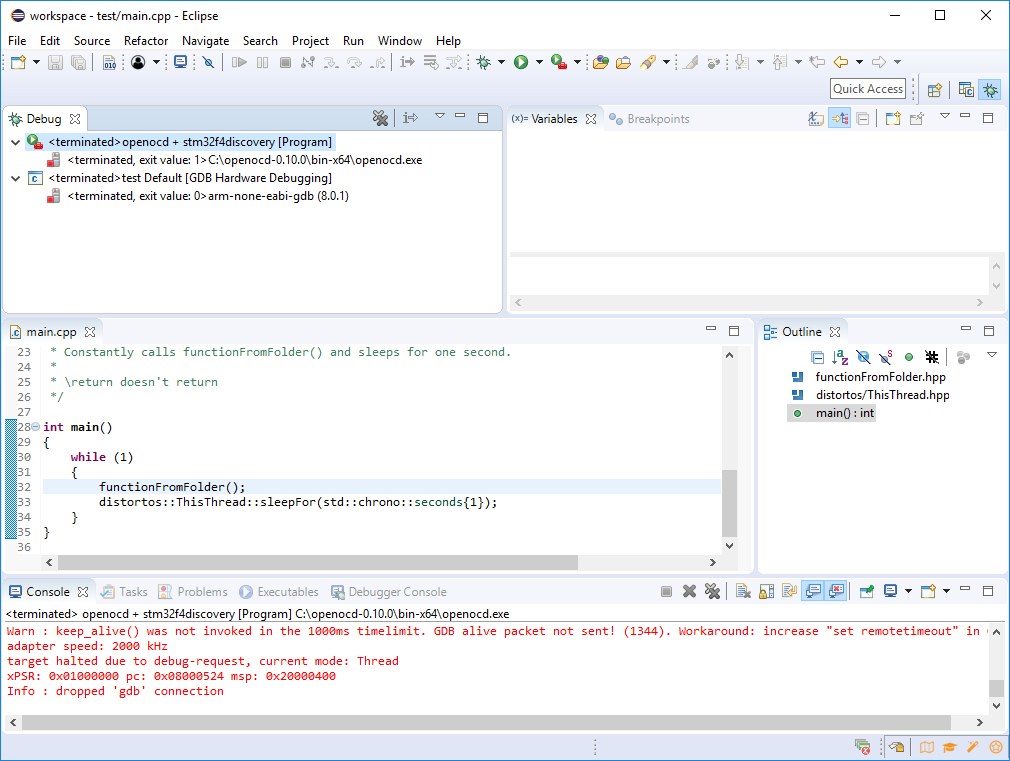
When the name of launch configuration and the name of executable are prefixed with <terminated>, it means that OpenOCD could not start successfully due to some problem. In this case some info about the root cause of such problem will be printed in the Console tab.
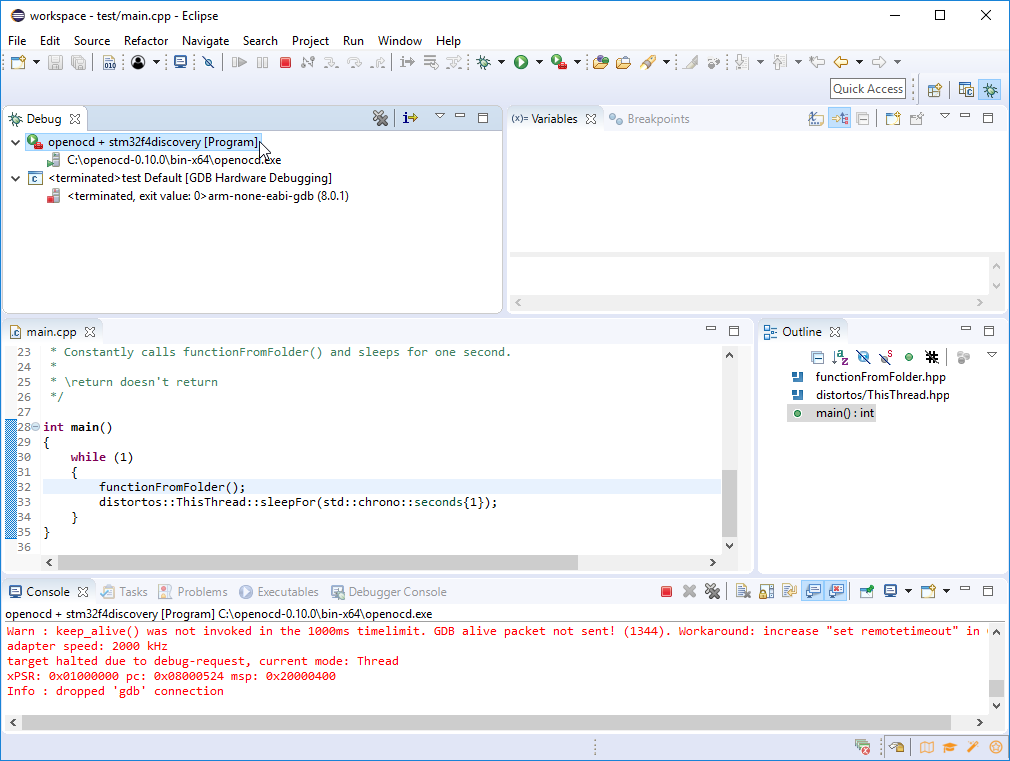
In future you may easily start this launch configuration again by clicking External Tools button in the middle of Eclipse’s toolbar (white play symbol inside green circle with a red toolbox). Clicking the button itself will start the last launch configuration which was used, while expanding the list with the black triangle on the right will give you access to the list of previously used launch configurations and the list of favorite configurations (the ones for which you selected the checkbox in Display in favorites menu).
Keep OpenOCD running, as we’ll need it for the next chapter.
Configuring and running GDB
This step is actually very similar to OpenOCD configuration, however it is usually dead simple – mostly because usually there are no hardware-dependent steps.
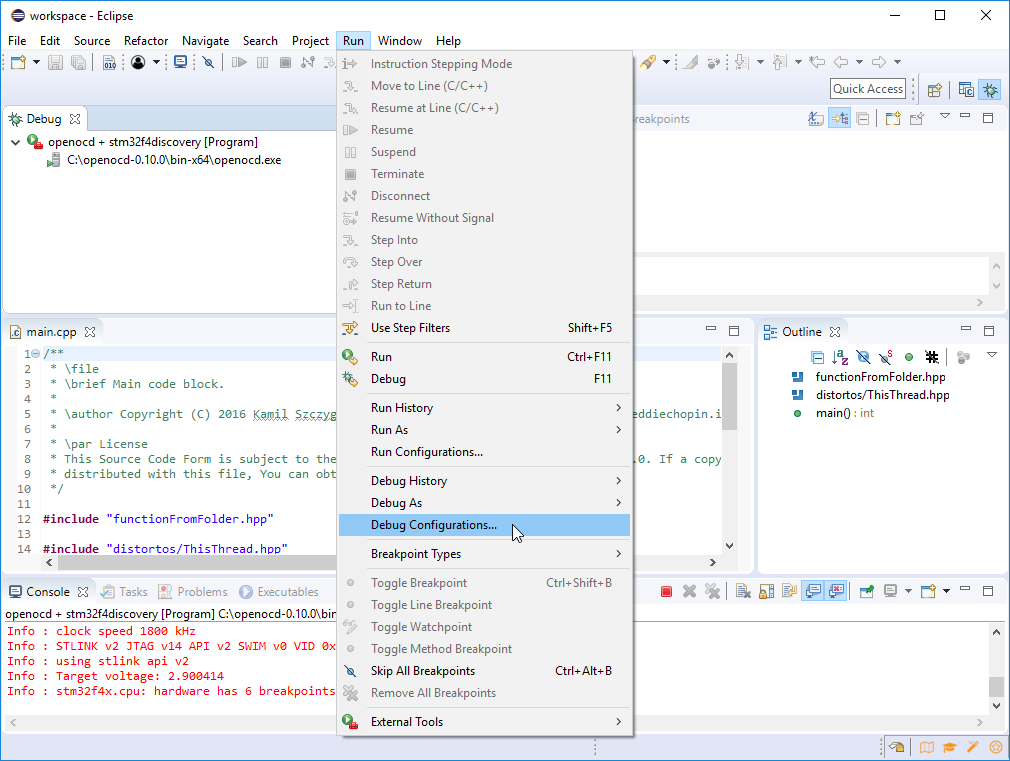
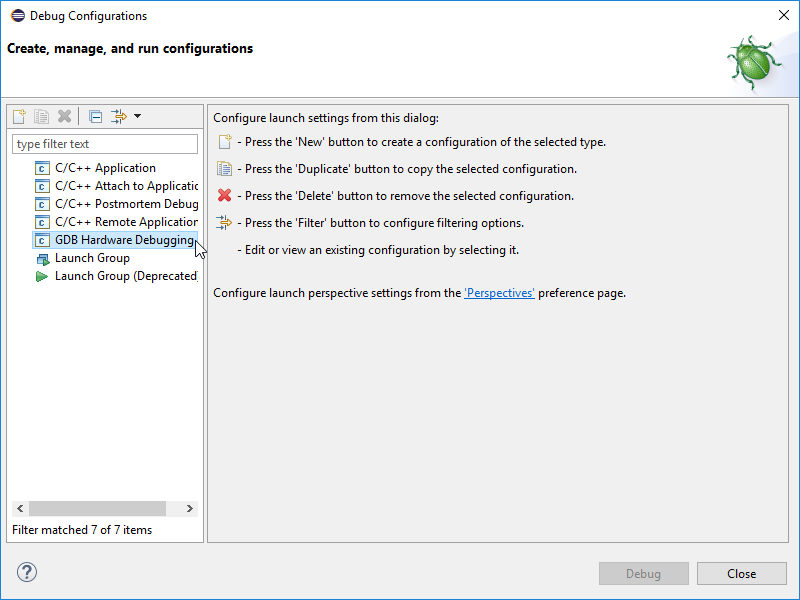
Click Run > Debug Configurations…, in the window that appears select GDB Hardware Debugging on the left and click New launch configuration button above the list. As previously, instead of using the New launch configuration button you can double-click on GDB Hardware Debugging item on the list to achieve the same effect.

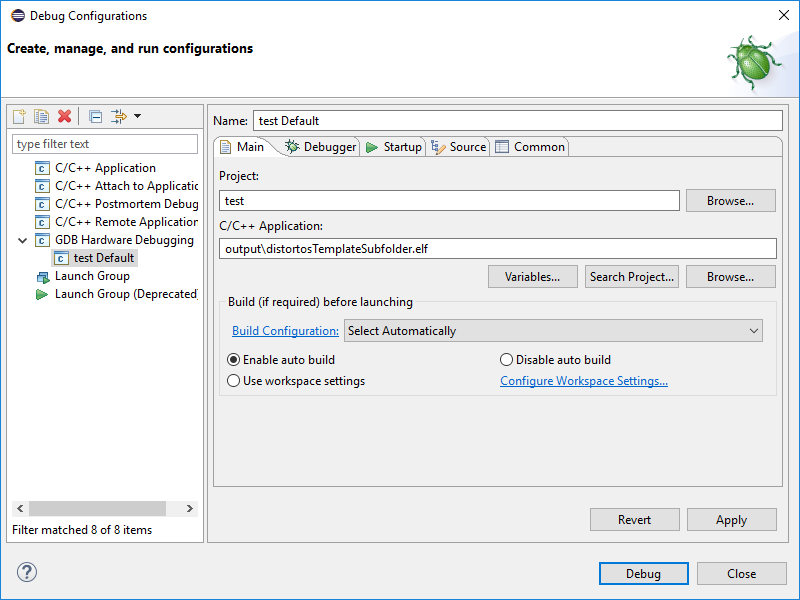
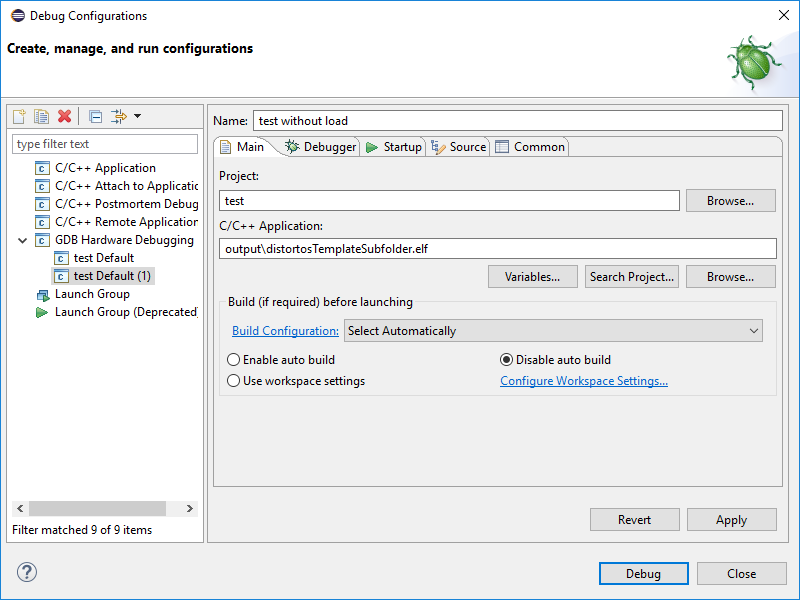
New configuration that we created should have Project and C/C++ Application text boxes in the Main tab already filled. If they are empty – don’t panic! First use Browse button next to Project field to select our test project and then click on Search Project… below C/C++ Application to find the .elf file which will be used by the debugger. Note – your project must be already built, otherwise there will be no .elf file to look for. Select Enable auto build radio button from the Build (if required) before launching group.
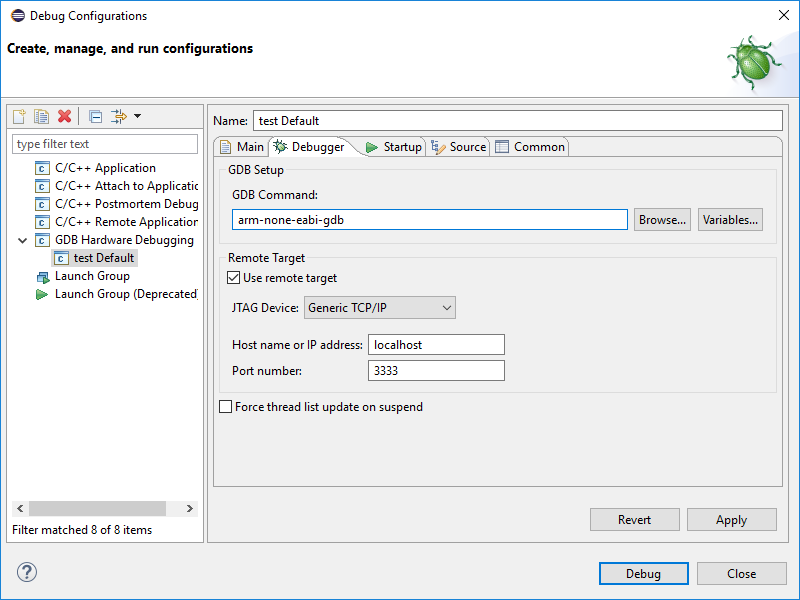
Switch to Debugger tab. Place the cursor in the GDB Command text field and replace default value with arm-none-eabi-gdb (which is the name of the debugger executable). You also have to change Port number to 3333.
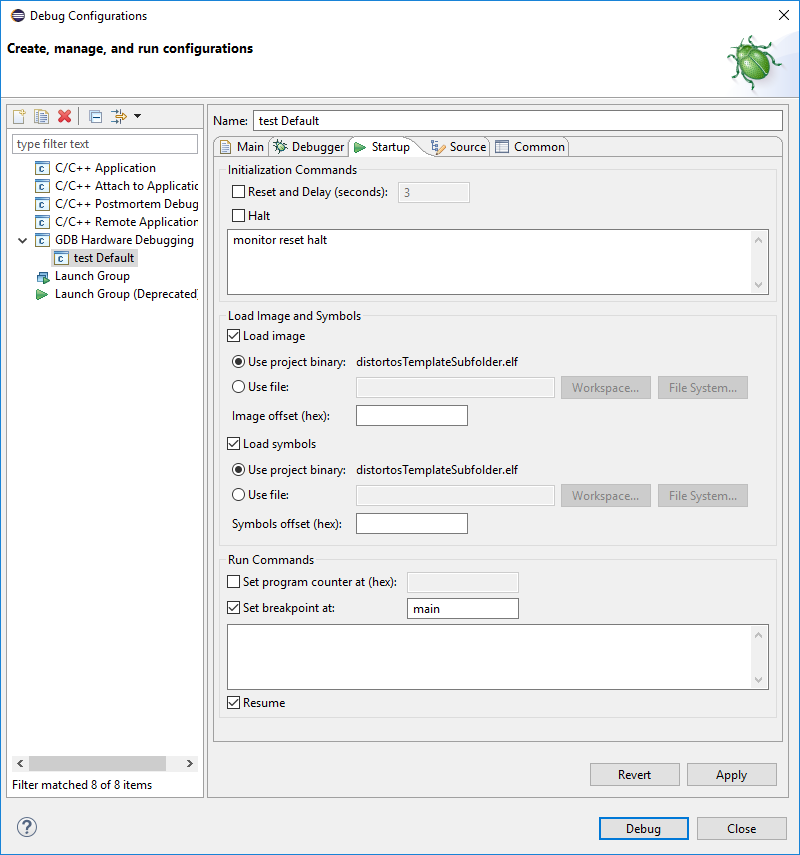
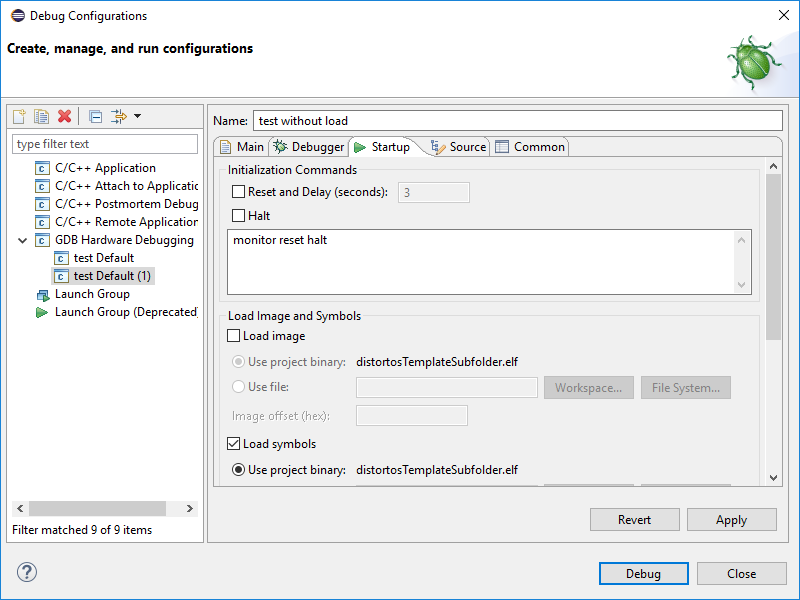
There are some more things to edit in the Startup tab. First deselect two checkboxes at the top, in the Initialization Commands group – Reset and Delay (seconds) and Halt. These checkboxes have zero effect when using OpenOCD, so just disable them. However we actually need to reset and halt the chip, so place the cursor just below these checkboxes and type monitor reset halt in there. If you are curious – monitor is GDB’s command which passes its arguments to GDB remote server (in this case – to OpenOCD), while reset halt is OpenOCD’s command which – surprisingly – resets and halts the chip (; Scroll to the bottom of this tab, select the checkbox left of Set breakpoint at and enter main into the text box on the right. Also select the checkbox next to Resume.
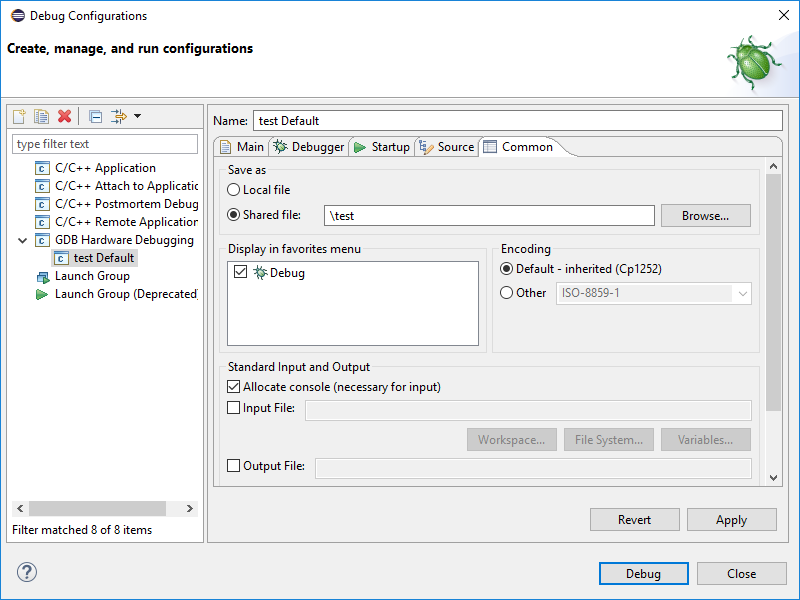
The idea with the last tab – Common – is identical to the one for OpenOCD, so there’s no point in repeating the description here.
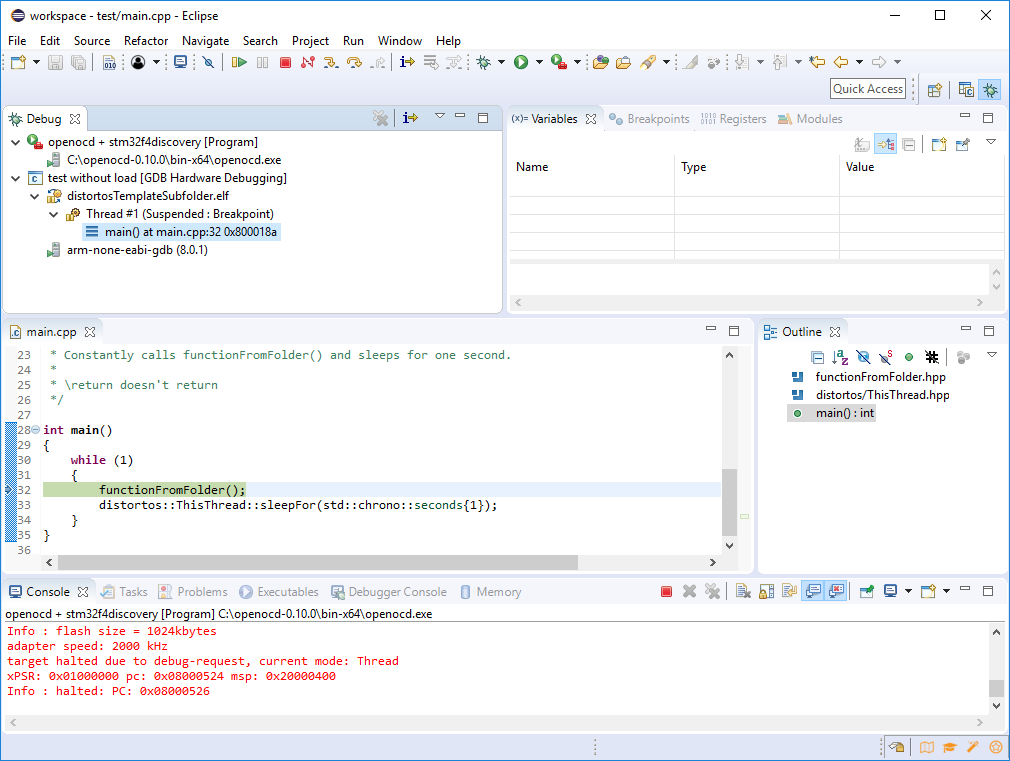
Hit Apply and click Debug. After a short while (a few seconds) you should see your debugging session halted at the beginning of main(). Voilà!
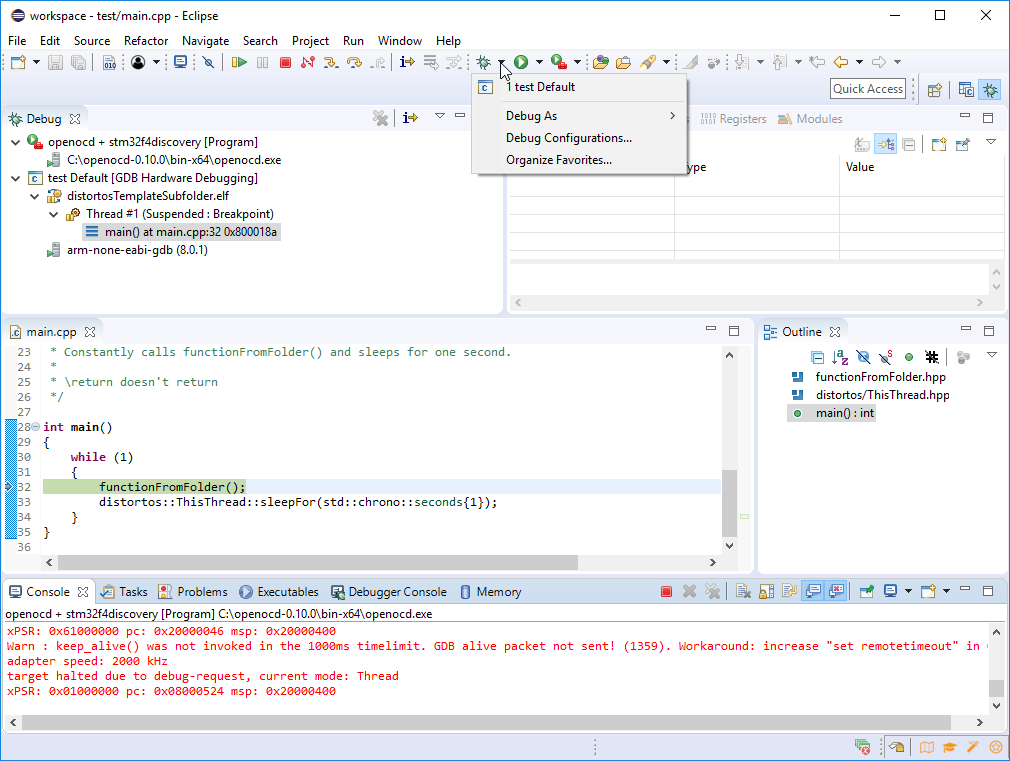
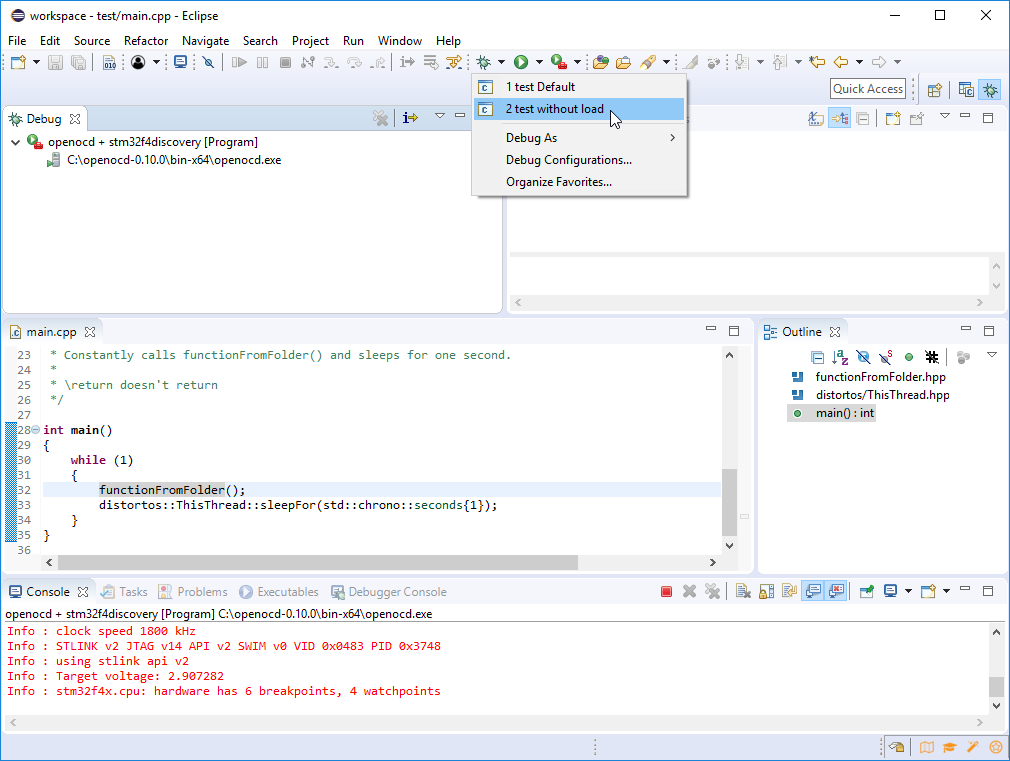
As with OpenOCD’s launch configuration, the one we just created for GDB is also easily accessible via Debug button in the center of Eclipse’s toolbar (green bug symbol). The behavior of button is also identical: clicking the button starts last used launch configuration, expand with black triangle shows list of favorites.
Terminating debug session and OpenOCD
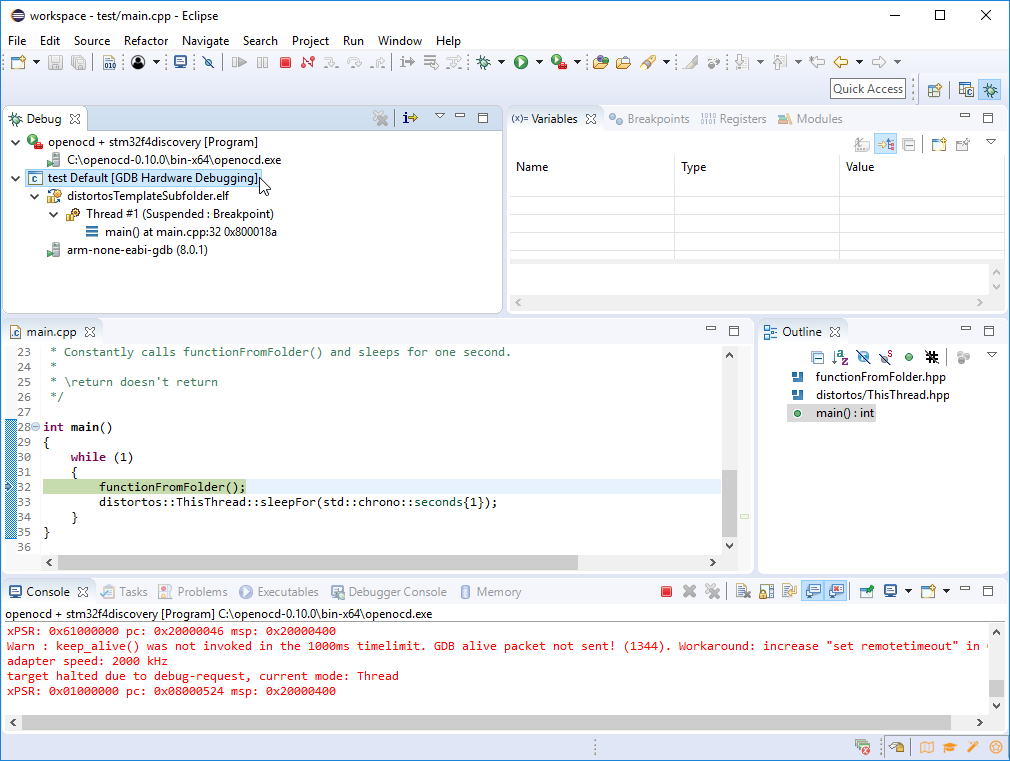
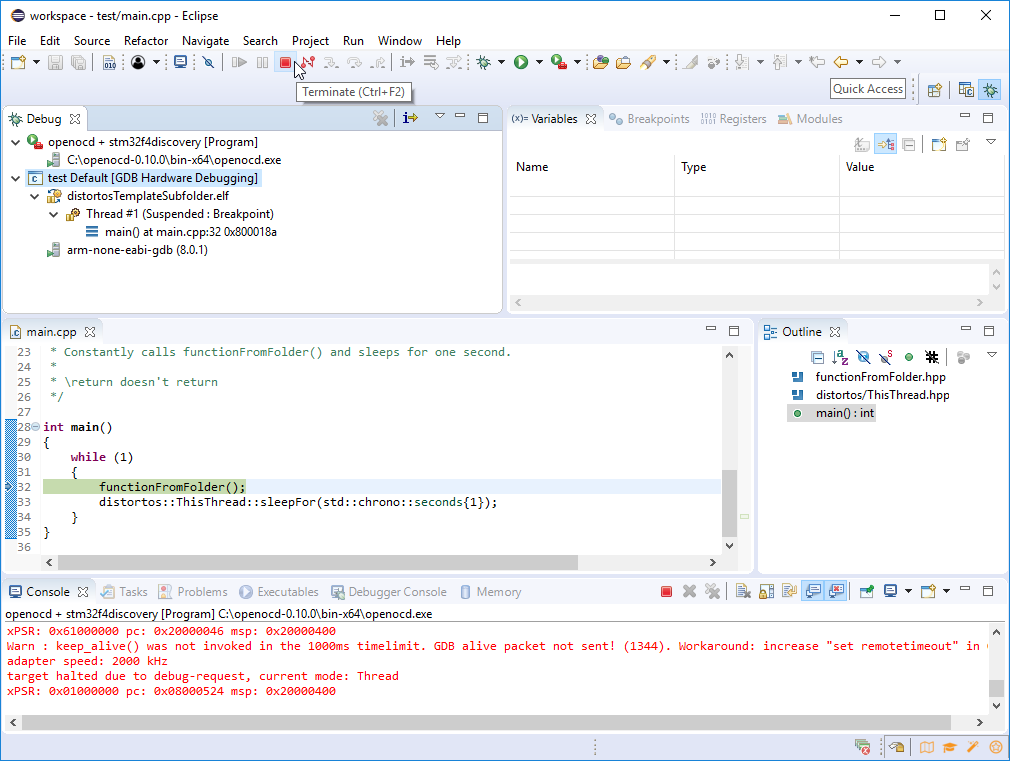
We know how to start the tools, but how can you stop them? It is recommended to first stop GDB and only then stop OpenOCD, as shutting down OpenOCD will cause GDB to abort – immediately or when you try to interact with it. This is actually logical – if you shut down GDB remote server (OpenOCD), GDB cannot continue without it. To terminate debug session you first have to select it from the list inside Debug tab. It doesn’t really matter which one you select, as long as it is the one tagged as GDB Hardware Debugging or any of its children. Then just click the Terminate button in Eclipse’s toolbar (red stop symbol).
The procedure to terminate OpenOCD is identical.

Debugging without programming the chip
When you start debugging session with the GDB launch configuration created in one of previous chapters, the application is first written into the chip’s flash memory. This is very convenient, however there are times where we would like to skip the programming – if we did not change the sources, but want to restart debugging session, there is no point in damaging the flash by erasing it just to program exactly the same image again.
Open Debug Configurations again (Run > Debug Configurations…), select our only debug configuration (test Default if you did not change the name given automatically by Eclipse) in the left list and duplicate it by clicking the second button from the left above the list (two filled sheets of paper). This can be also done by right-clicking the configuration and selecting Duplicate.
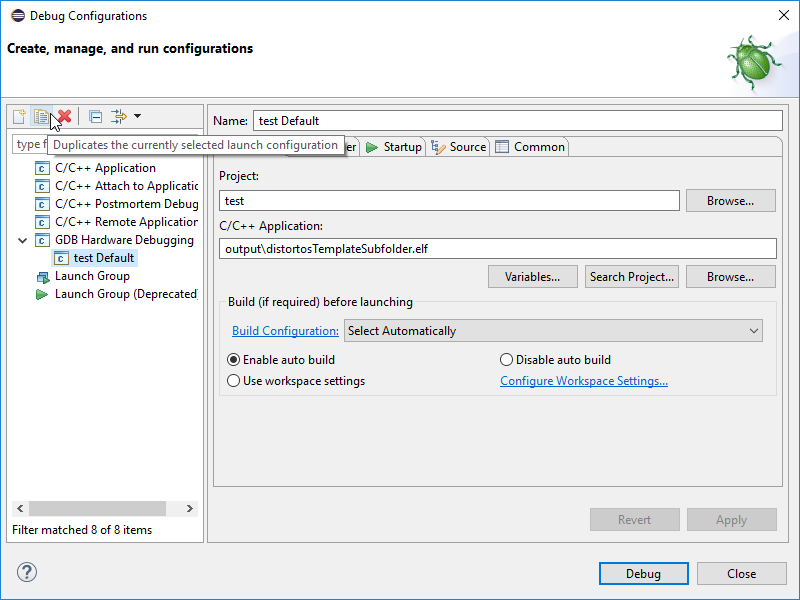
First thing to do in the newly created configuration is to give it some better name – for example test without load. Next, on the Main tab select Disable auto build radio button in the Build (if required) before launching group to prevent Eclipse from recompiling the application. Switch to Startup tab and deselect Load image from Load image and Symbols group. Click Apply and then Close.
Start OpenOCD (if it is not already running) and start our new GDB configuration. If everything worked fine, you should see something very similar as previously, however the launch takes considerably less time – in here (on VirtualBox) ~3 seconds vs ~9 seconds with programming.
Debugging the application
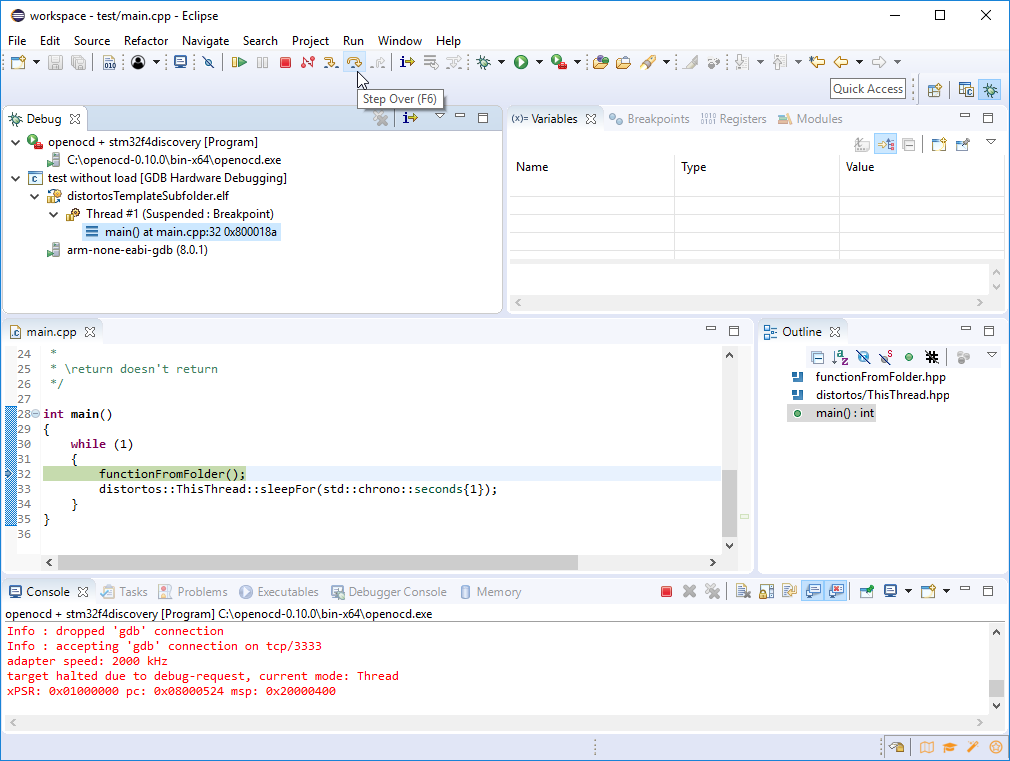
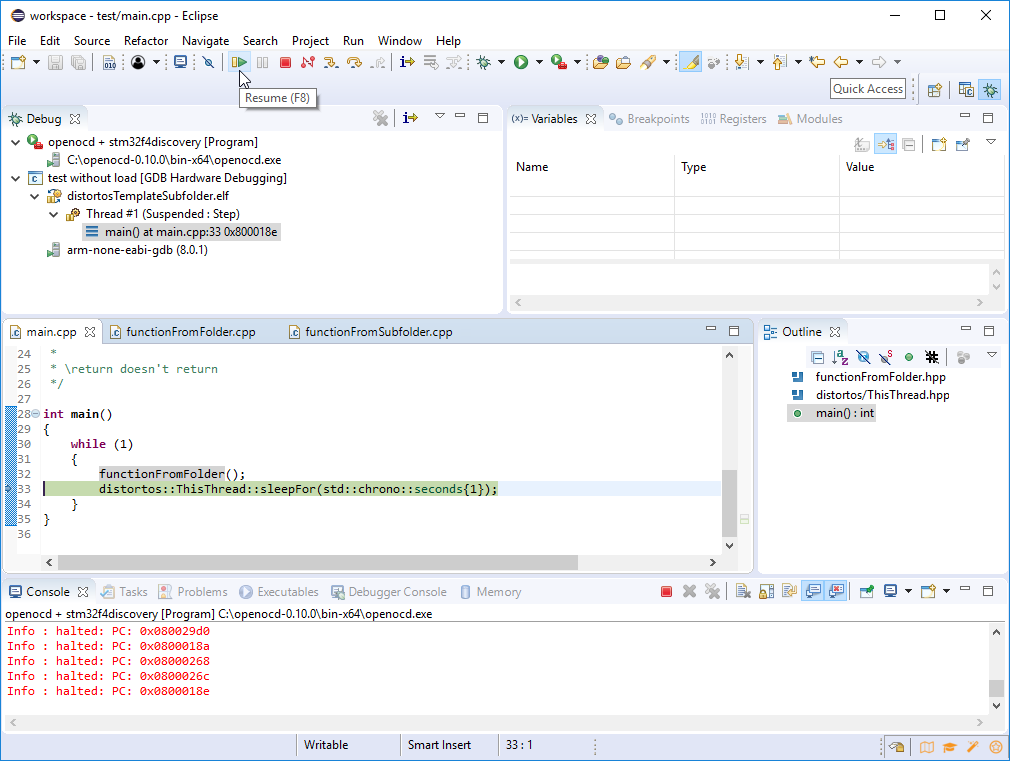
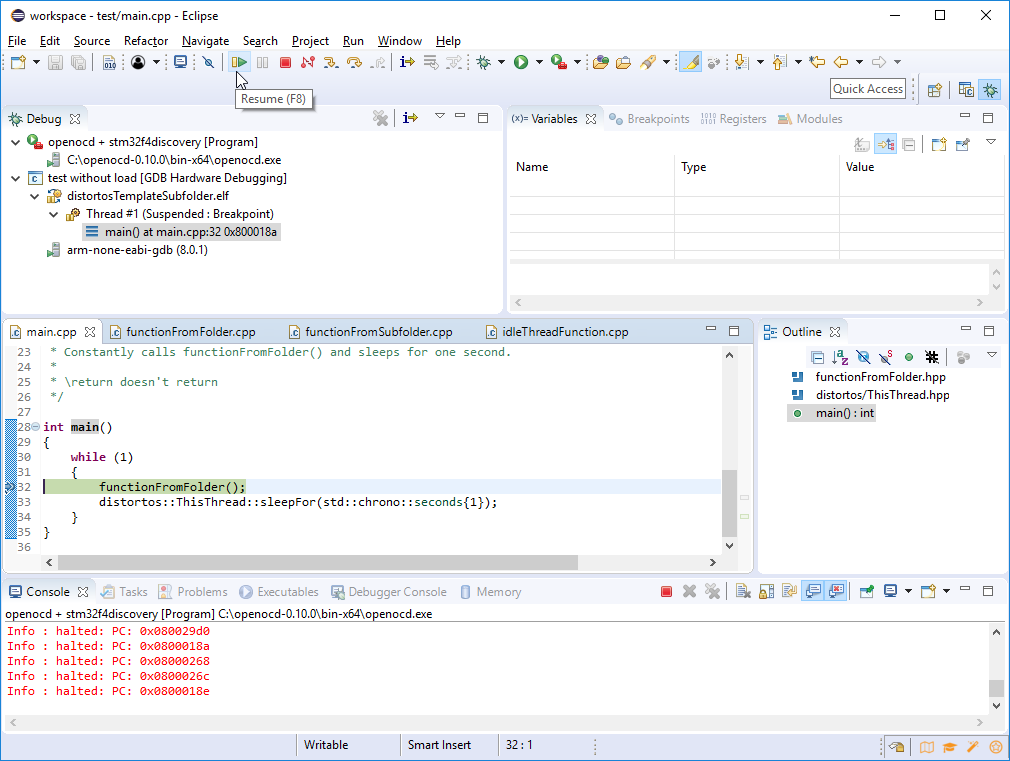
Let’s finally see some action! Start with something simple – click Step Over button from Eclipse’s toolbar (second yellow arrow, the one which goes up-right-down). After a short moment you’ll see that your program did in fact advance – green text highlight and blue margin arrow are now at line 33 – the one with distortos::ThisThread::sleepFor(std::chrono::seconds{1});. Let’s try the same thing one more time – now it will take a bit longer (after all, you are “stepping over” a one second long delay), but eventually we’ll hit line 32 again.

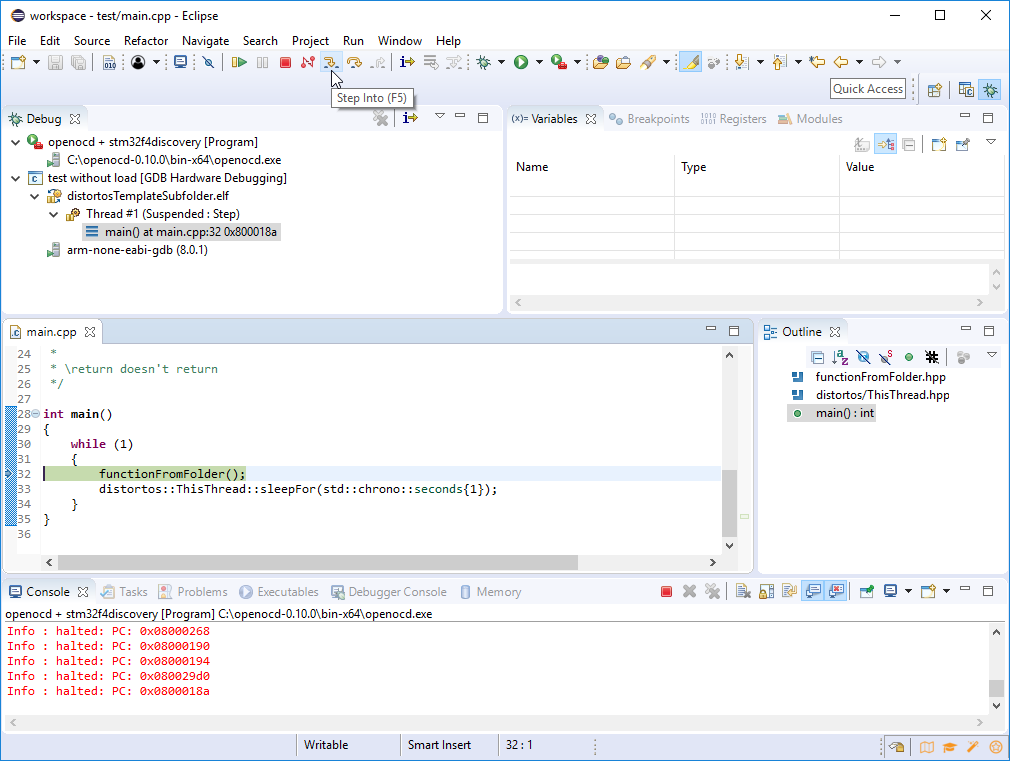
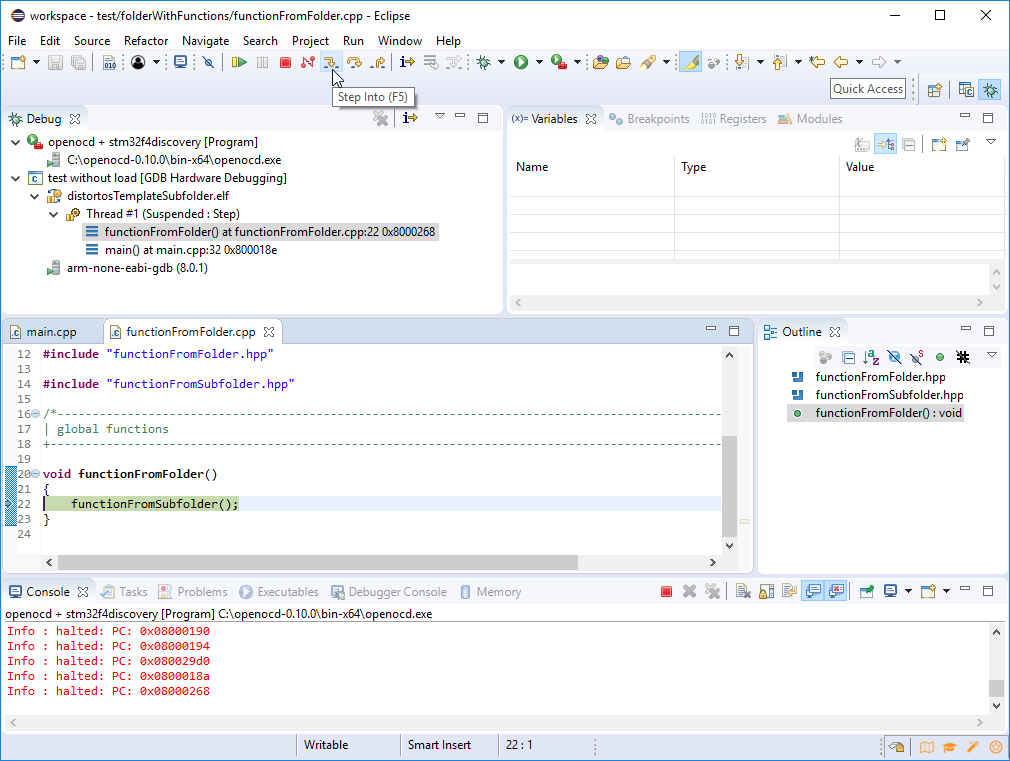
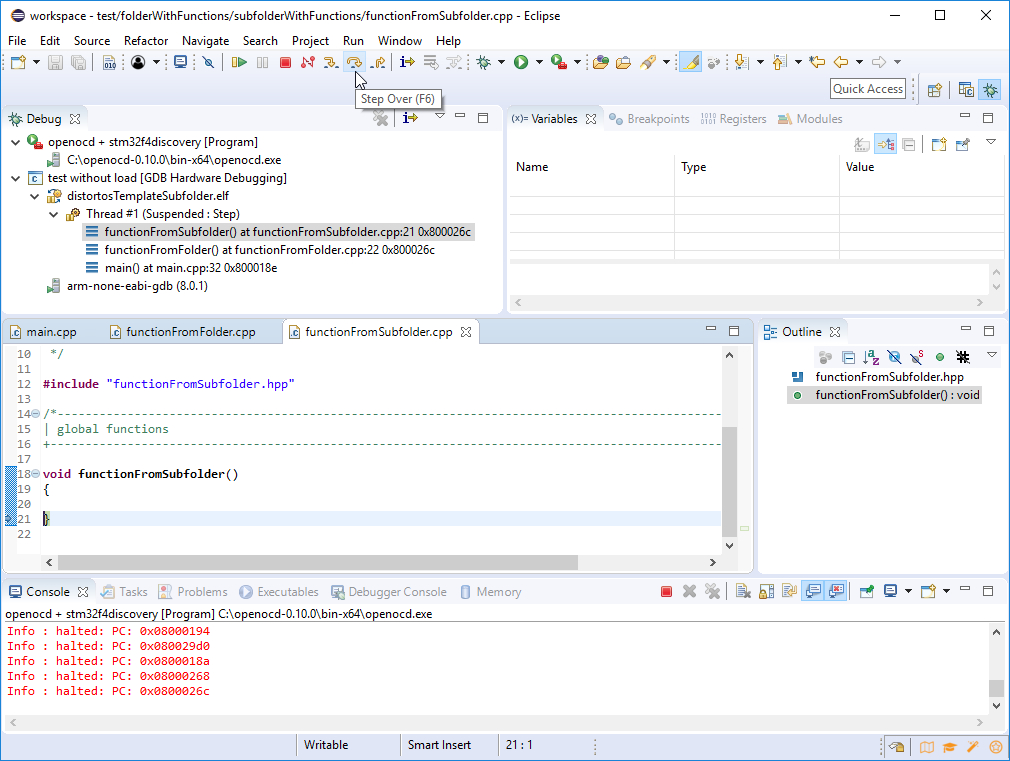
Now click Step Into button (first yellow arrow, this one goes right-down). You’ll see that new editor tab is opened and we are now inside functionFromFolder(). If you click Step Into again, you’ll finally end up in functionFromSubfolder(). Click Step Over to get back to main().
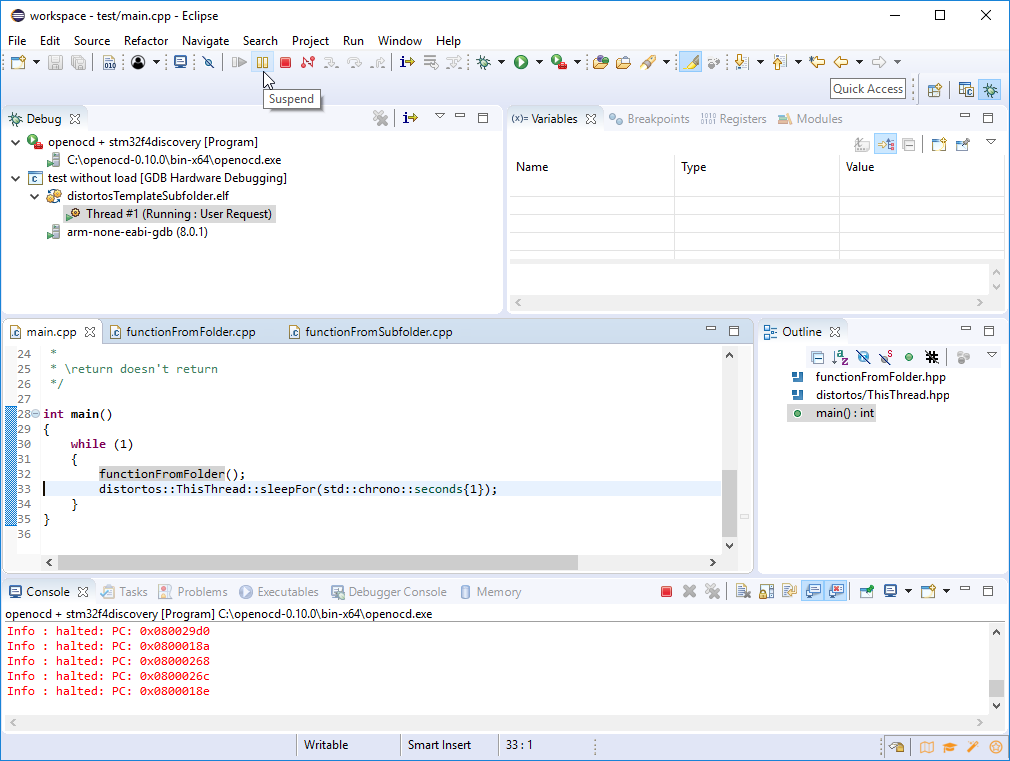
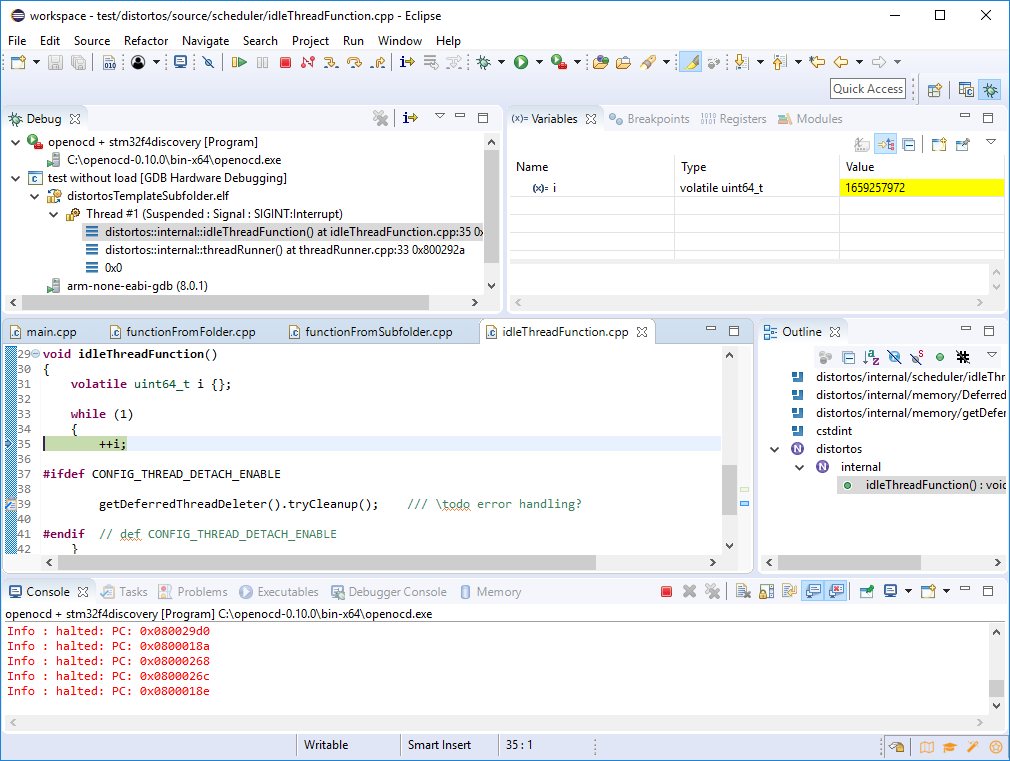
Let’s see what happens when you click Resume button (yellow rectangle with green play symbol). Hmm… nothing spectacular, but it seems the application is indeed running. Lets stop it by clicking Suspend button (yellow pause symbol) – we end up in some totally random place, most likely somewhere in the idle thread.
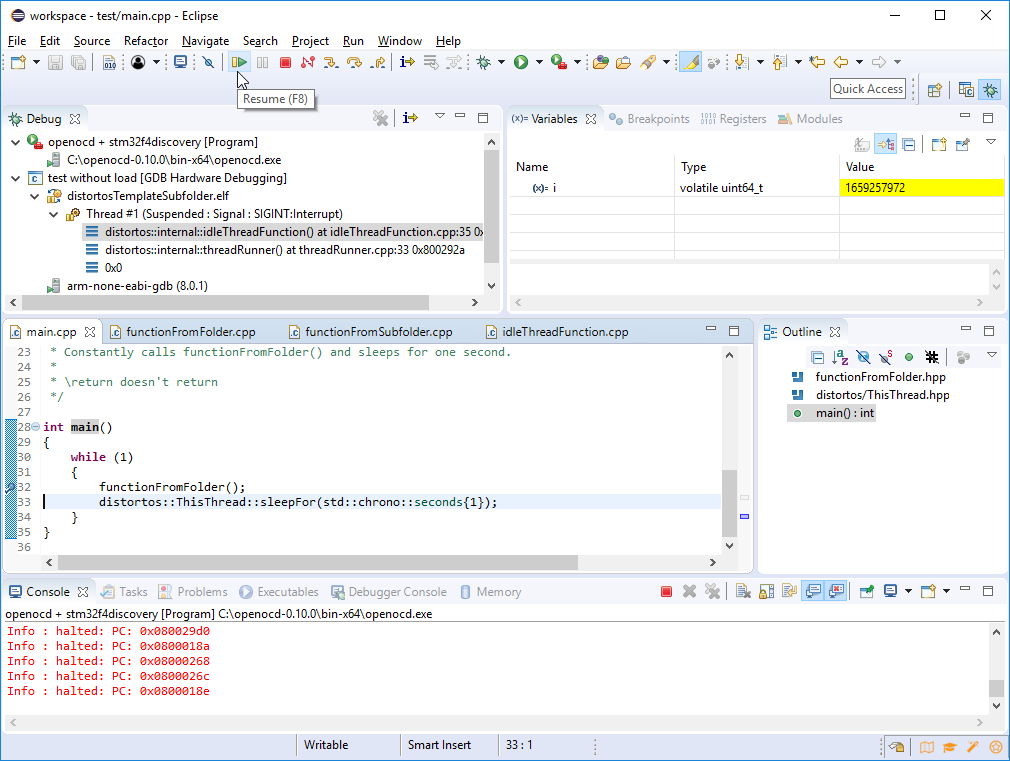
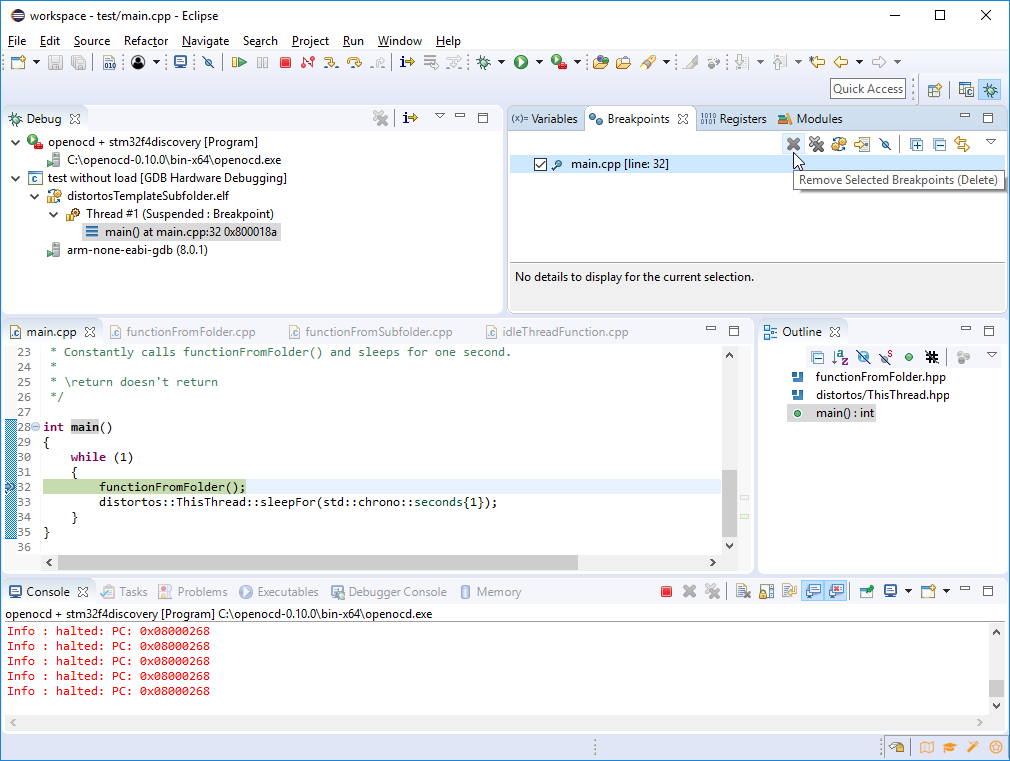
So how do we get back to our main thread? In the editor switch to the tab with main.cpp and place breakpoint at line 32 by double clicking on the checkered margin (left from the line numbers). If you did that right, you should see a blue circle with a check mark there. Hit Resume and pretty quickly the program will be halted inside main(). If you resume it again, it will keep halting at the same spot after completing the loop cycle.

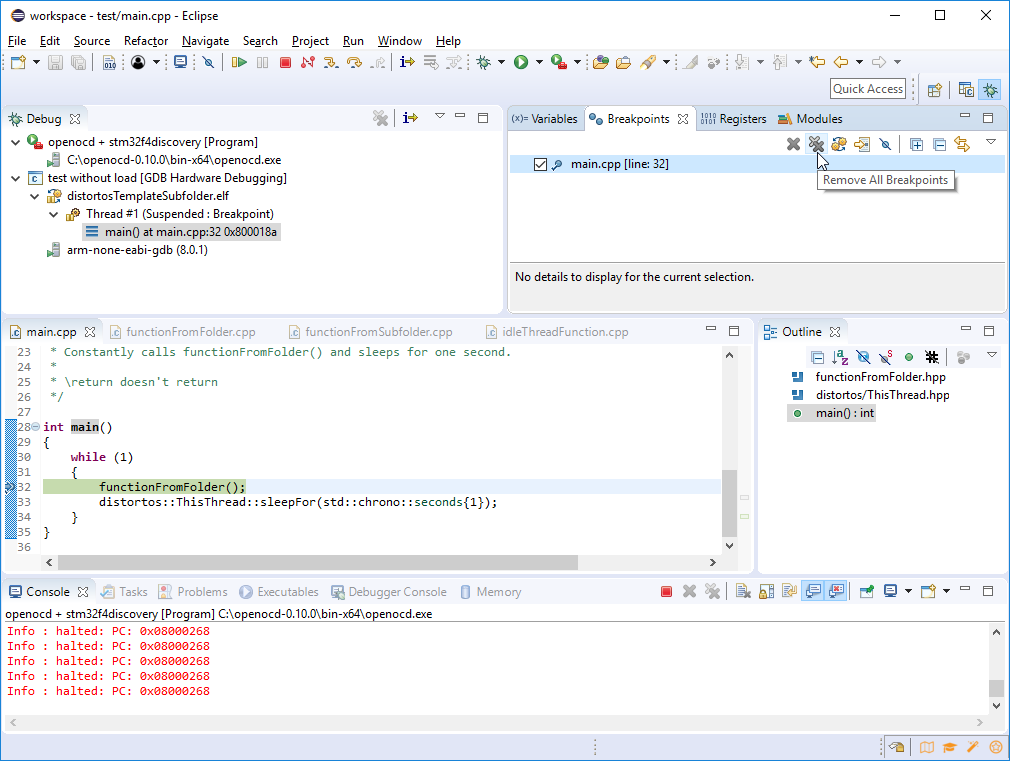
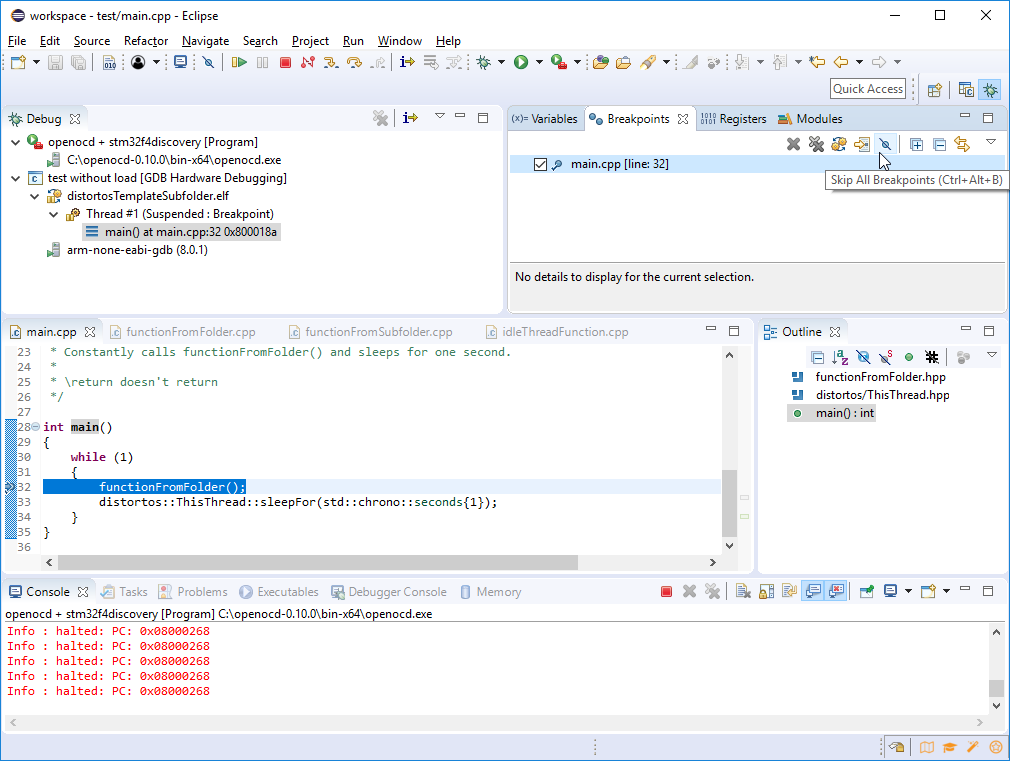
To remove the breakpoint either double-click it or switch to Breakpoints tab and delete it there. You can either remove selected breakpoint (single gray x) or remove all breakpoints used in the application (two gray x-es). Additionally it is also possible to disable breakpoints – all at once with Skip All Breakpoints button (crossed out blue circle) or one by one with their checkboxes.

This is just a brief overview of debugging in Eclipse, but hopefully it will give you a good starting point. Eclipse’s debugger is very powerful, so it is not possible to cover all of the advanced topics in one article. The same is true for OpenOCD configuration – a topic which could fill several articles easily. The foundation is laid out, rest will come with practice and personal experience.
Hi,
just a quick question that popped up when reading this:
does it support multi-thread debugging, like e.g. J-Link does with its RTOS plugin with switching between stacks and inspecting stack-local variables?
I guess STL pretty printing depends on the IDE, right? I’ve had that working once using eclipse CDT + gnuarm eclipse plugin.
Thanks for the good work though!
> does it support multi-thread debugging, like e.g. J-Link does with its RTOS plugin with switching between stacks and inspecting stack-local variables?
Such feature would require support for distortos in OpenOCD. This is certainly possible (OpenOCD supports some other RTOSes) and definitely on my to-do list. If you think this should be prioritised, just let me know. For now I did not implement such thing, as the RTOS is not perfectly stable yet. However typical OpenOCD support for RTOS is based on fixed symbols and fixed offsets – so I would either have to freeze structures in the RTOS (bad for possible future improvements) or maintain my private fork of OpenOCD (bad for users as they would most likely have to build from source). The third option is to make it a bit more flexible and/or configurable – this is the approach I would like to take, but… time is limited and I did not yet manage to start it.
> I guess STL pretty printing depends on the IDE, right? I’ve had that working once using eclipse CDT + gnuarm eclipse plugin.
Yes, it depends on the IDE. You just need to start GDB session with proper `.gdbinit` file to enable this in GDB itself. Then it’s up to the IDE to properly display such objects. For example it works very good in Eclipse (screenshots here are from Eclipse – https://distortos.org/news/distortos-0-5-0-released/ ). Doing the same in Visual Studio Code is limited – last time I tried it was only able to display first-level only – for example if you have a list with objects which contain another list, then VSC would pretty print the outer list but fail with the inner one. Maybe they already fixed/improved that, don’t know (;